Central American Indian vs Immigrants from Vietnam 9th Grade
COMPARE
Central American Indian
Immigrants from Vietnam
9th Grade
9th Grade Comparison
Central American Indians
Immigrants from Vietnam
91.5%
9TH GRADE
0.0/ 100
METRIC RATING
325th/ 347
METRIC RANK
92.6%
9TH GRADE
0.0/ 100
METRIC RATING
306th/ 347
METRIC RANK
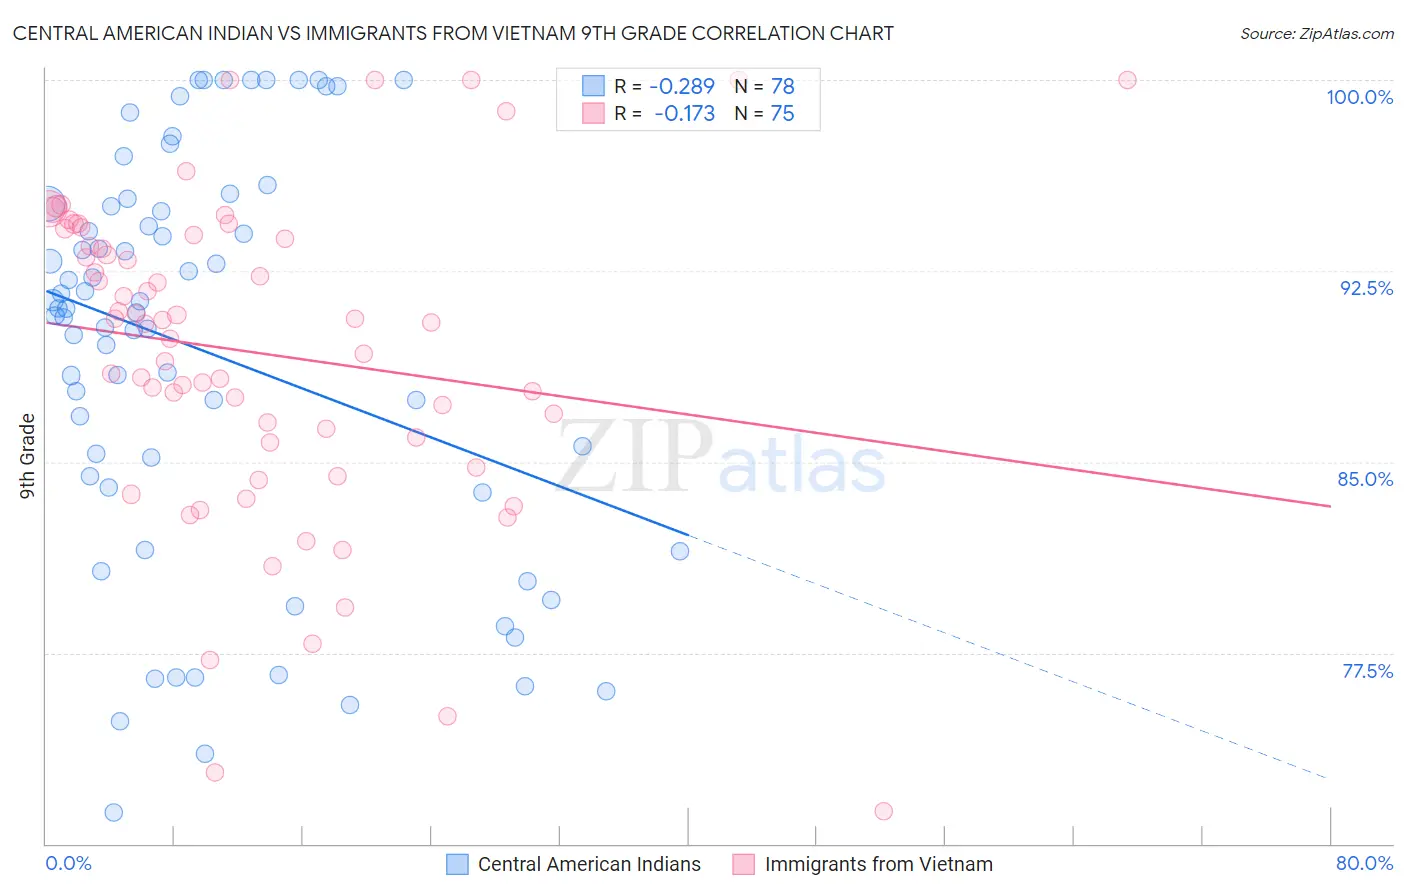
Central American Indian vs Immigrants from Vietnam 9th Grade Correlation Chart
The statistical analysis conducted on geographies consisting of 326,142,359 people shows a weak negative correlation between the proportion of Central American Indians and percentage of population with at least 9th grade education in the United States with a correlation coefficient (R) of -0.289 and weighted average of 91.5%. Similarly, the statistical analysis conducted on geographies consisting of 404,843,921 people shows a poor negative correlation between the proportion of Immigrants from Vietnam and percentage of population with at least 9th grade education in the United States with a correlation coefficient (R) of -0.173 and weighted average of 92.6%, a difference of 1.3%.
9th Grade Correlation Summary
| Measurement | Central American Indian | Immigrants from Vietnam |
| Minimum | 71.2% | 71.3% |
| Maximum | 100.0% | 100.0% |
| Range | 28.8% | 28.7% |
| Mean | 89.3% | 89.3% |
| Median | 90.9% | 90.5% |
| Interquartile 25% (IQ1) | 84.0% | 85.8% |
| Interquartile 75% (IQ3) | 95.1% | 93.9% |
| Interquartile Range (IQR) | 11.1% | 8.2% |
| Standard Deviation (Sample) | 7.9% | 6.3% |
| Standard Deviation (Population) | 7.8% | 6.2% |
Demographics Similar to Central American Indians and Immigrants from Vietnam by 9th Grade
In terms of 9th grade, the demographic groups most similar to Central American Indians are Immigrants from Belize (91.8%, a difference of 0.33%), Belizean (91.8%, a difference of 0.39%), Puerto Rican (91.8%, a difference of 0.39%), Immigrants from Ecuador (91.8%, a difference of 0.42%), and Nicaraguan (91.9%, a difference of 0.48%). Similarly, the demographic groups most similar to Immigrants from Vietnam are Japanese (92.6%, a difference of 0.0%), Immigrants (92.5%, a difference of 0.10%), Immigrants from Guyana (92.5%, a difference of 0.11%), Immigrants from Bangladesh (92.4%, a difference of 0.26%), and Immigrants from Cambodia (92.4%, a difference of 0.28%).
| Demographics | Rating | Rank | 9th Grade |
| Japanese | 0.0 /100 | #305 | Tragic 92.6% |
| Immigrants | Vietnam | 0.0 /100 | #306 | Tragic 92.6% |
| Immigrants | Immigrants | 0.0 /100 | #307 | Tragic 92.5% |
| Immigrants | Guyana | 0.0 /100 | #308 | Tragic 92.5% |
| Immigrants | Bangladesh | 0.0 /100 | #309 | Tragic 92.4% |
| Immigrants | Cambodia | 0.0 /100 | #310 | Tragic 92.4% |
| Immigrants | Fiji | 0.0 /100 | #311 | Tragic 92.3% |
| Houma | 0.0 /100 | #312 | Tragic 92.3% |
| Vietnamese | 0.0 /100 | #313 | Tragic 92.3% |
| Immigrants | Portugal | 0.0 /100 | #314 | Tragic 92.2% |
| Immigrants | Caribbean | 0.0 /100 | #315 | Tragic 92.2% |
| Cape Verdeans | 0.0 /100 | #316 | Tragic 92.2% |
| Immigrants | Cuba | 0.0 /100 | #317 | Tragic 92.2% |
| Nepalese | 0.0 /100 | #318 | Tragic 92.0% |
| Ecuadorians | 0.0 /100 | #319 | Tragic 91.9% |
| Nicaraguans | 0.0 /100 | #320 | Tragic 91.9% |
| Immigrants | Ecuador | 0.0 /100 | #321 | Tragic 91.8% |
| Belizeans | 0.0 /100 | #322 | Tragic 91.8% |
| Puerto Ricans | 0.0 /100 | #323 | Tragic 91.8% |
| Immigrants | Belize | 0.0 /100 | #324 | Tragic 91.8% |
| Central American Indians | 0.0 /100 | #325 | Tragic 91.5% |