Bhutanese vs Yup'ik Single Father Households
COMPARE
Bhutanese
Yup'ik
Single Father Households
Single Father Households Comparison
Bhutanese
Yup'ik
2.1%
SINGLE FATHER HOUSEHOLDS
99.5/ 100
METRIC RATING
88th/ 347
METRIC RANK
5.4%
SINGLE FATHER HOUSEHOLDS
0.0/ 100
METRIC RATING
347th/ 347
METRIC RANK
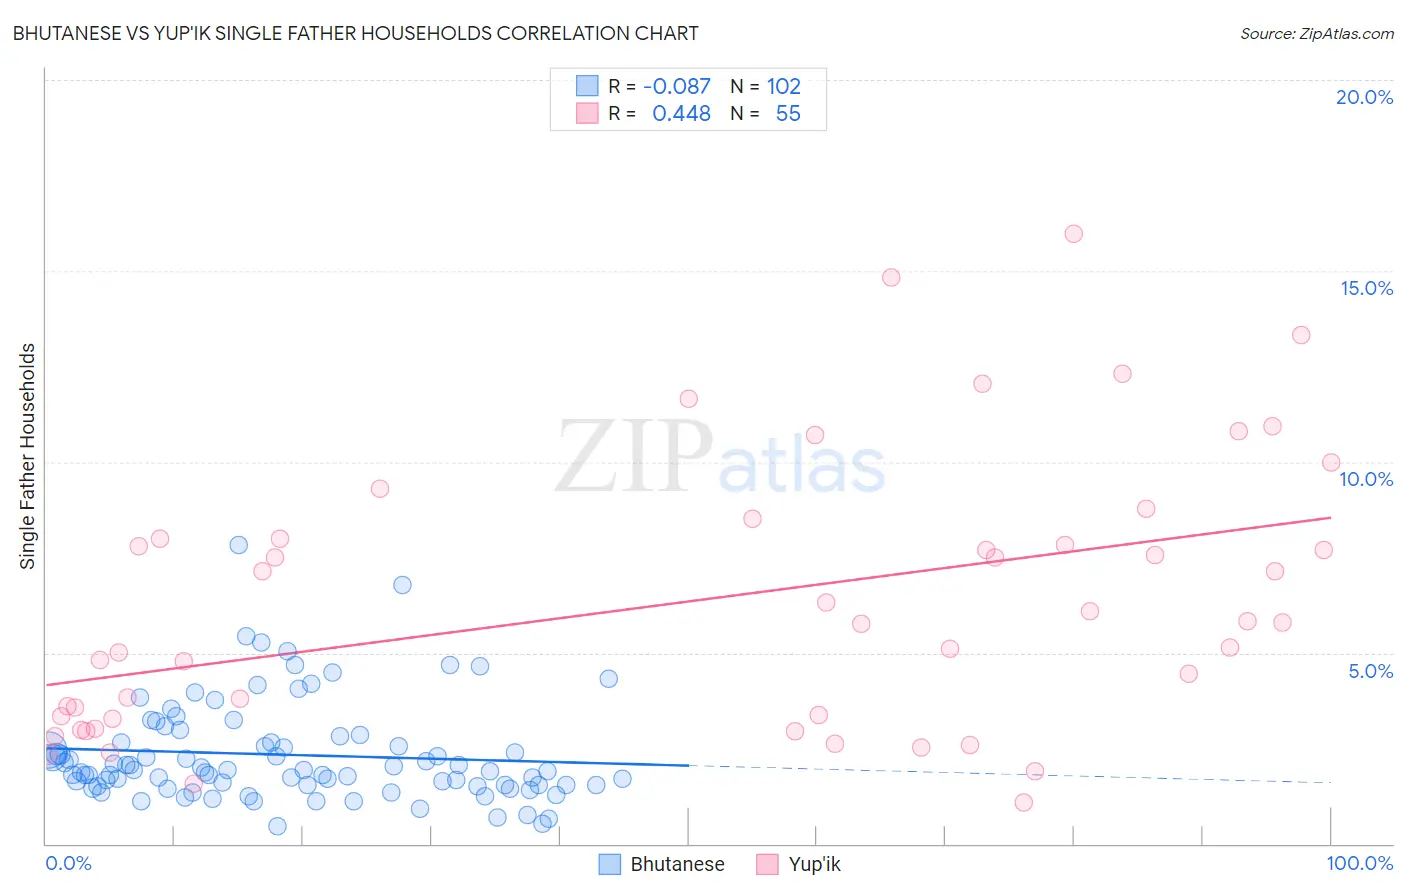
Bhutanese vs Yup'ik Single Father Households Correlation Chart
The statistical analysis conducted on geographies consisting of 450,482,279 people shows a slight negative correlation between the proportion of Bhutanese and percentage of single father households in the United States with a correlation coefficient (R) of -0.087 and weighted average of 2.1%. Similarly, the statistical analysis conducted on geographies consisting of 39,844,745 people shows a moderate positive correlation between the proportion of Yup'ik and percentage of single father households in the United States with a correlation coefficient (R) of 0.448 and weighted average of 5.4%, a difference of 154.7%.
Single Father Households Correlation Summary
| Measurement | Bhutanese | Yup'ik |
| Minimum | 0.45% | 1.1% |
| Maximum | 7.8% | 16.0% |
| Range | 7.4% | 14.9% |
| Mean | 2.3% | 6.3% |
| Median | 1.9% | 5.8% |
| Interquartile 25% (IQ1) | 1.5% | 3.3% |
| Interquartile 75% (IQ3) | 2.7% | 8.0% |
| Interquartile Range (IQR) | 1.1% | 4.7% |
| Standard Deviation (Sample) | 1.3% | 3.6% |
| Standard Deviation (Population) | 1.3% | 3.5% |
Similar Demographics by Single Father Households
Demographics Similar to Bhutanese by Single Father Households
In terms of single father households, the demographic groups most similar to Bhutanese are Immigrants from Armenia (2.1%, a difference of 0.050%), Immigrants from Pakistan (2.1%, a difference of 0.060%), Lithuanian (2.1%, a difference of 0.13%), Immigrants from Guyana (2.1%, a difference of 0.30%), and Romanian (2.1%, a difference of 0.39%).
| Demographics | Rating | Rank | Single Father Households |
| Armenians | 99.7 /100 | #81 | Exceptional 2.1% |
| New Zealanders | 99.7 /100 | #82 | Exceptional 2.1% |
| Greeks | 99.7 /100 | #83 | Exceptional 2.1% |
| Carpatho Rusyns | 99.6 /100 | #84 | Exceptional 2.1% |
| Immigrants | Hungary | 99.6 /100 | #85 | Exceptional 2.1% |
| Asians | 99.6 /100 | #86 | Exceptional 2.1% |
| Lithuanians | 99.5 /100 | #87 | Exceptional 2.1% |
| Bhutanese | 99.5 /100 | #88 | Exceptional 2.1% |
| Immigrants | Armenia | 99.5 /100 | #89 | Exceptional 2.1% |
| Immigrants | Pakistan | 99.5 /100 | #90 | Exceptional 2.1% |
| Immigrants | Guyana | 99.4 /100 | #91 | Exceptional 2.1% |
| Romanians | 99.4 /100 | #92 | Exceptional 2.1% |
| Croatians | 99.3 /100 | #93 | Exceptional 2.1% |
| Ukrainians | 99.3 /100 | #94 | Exceptional 2.1% |
| Bermudans | 99.2 /100 | #95 | Exceptional 2.1% |
Demographics Similar to Yup'ik by Single Father Households
In terms of single father households, the demographic groups most similar to Yup'ik are Inupiat (4.9%, a difference of 10.7%), Menominee (4.2%, a difference of 27.7%), Yakama (4.2%, a difference of 28.6%), Pima (4.2%, a difference of 28.9%), and Tohono O'odham (3.8%, a difference of 40.8%).
| Demographics | Rating | Rank | Single Father Households |
| Natives/Alaskans | 0.0 /100 | #333 | Tragic 3.2% |
| Yuman | 0.0 /100 | #334 | Tragic 3.3% |
| Colville | 0.0 /100 | #335 | Tragic 3.3% |
| Paiute | 0.0 /100 | #336 | Tragic 3.3% |
| Pueblo | 0.0 /100 | #337 | Tragic 3.3% |
| Sioux | 0.0 /100 | #338 | Tragic 3.3% |
| Alaskan Athabascans | 0.0 /100 | #339 | Tragic 3.4% |
| Alaska Natives | 0.0 /100 | #340 | Tragic 3.5% |
| Crow | 0.0 /100 | #341 | Tragic 3.5% |
| Tohono O'odham | 0.0 /100 | #342 | Tragic 3.8% |
| Pima | 0.0 /100 | #343 | Tragic 4.2% |
| Yakama | 0.0 /100 | #344 | Tragic 4.2% |
| Menominee | 0.0 /100 | #345 | Tragic 4.2% |
| Inupiat | 0.0 /100 | #346 | Tragic 4.9% |
| Yup'ik | 0.0 /100 | #347 | Tragic 5.4% |