Immigrants from Russia vs Central American Single Father Households
COMPARE
Immigrants from Russia
Central American
Single Father Households
Single Father Households Comparison
Immigrants from Russia
Central Americans
2.0%
SINGLE FATHER HOUSEHOLDS
100.0/ 100
METRIC RATING
24th/ 347
METRIC RANK
2.9%
SINGLE FATHER HOUSEHOLDS
0.0/ 100
METRIC RATING
309th/ 347
METRIC RANK
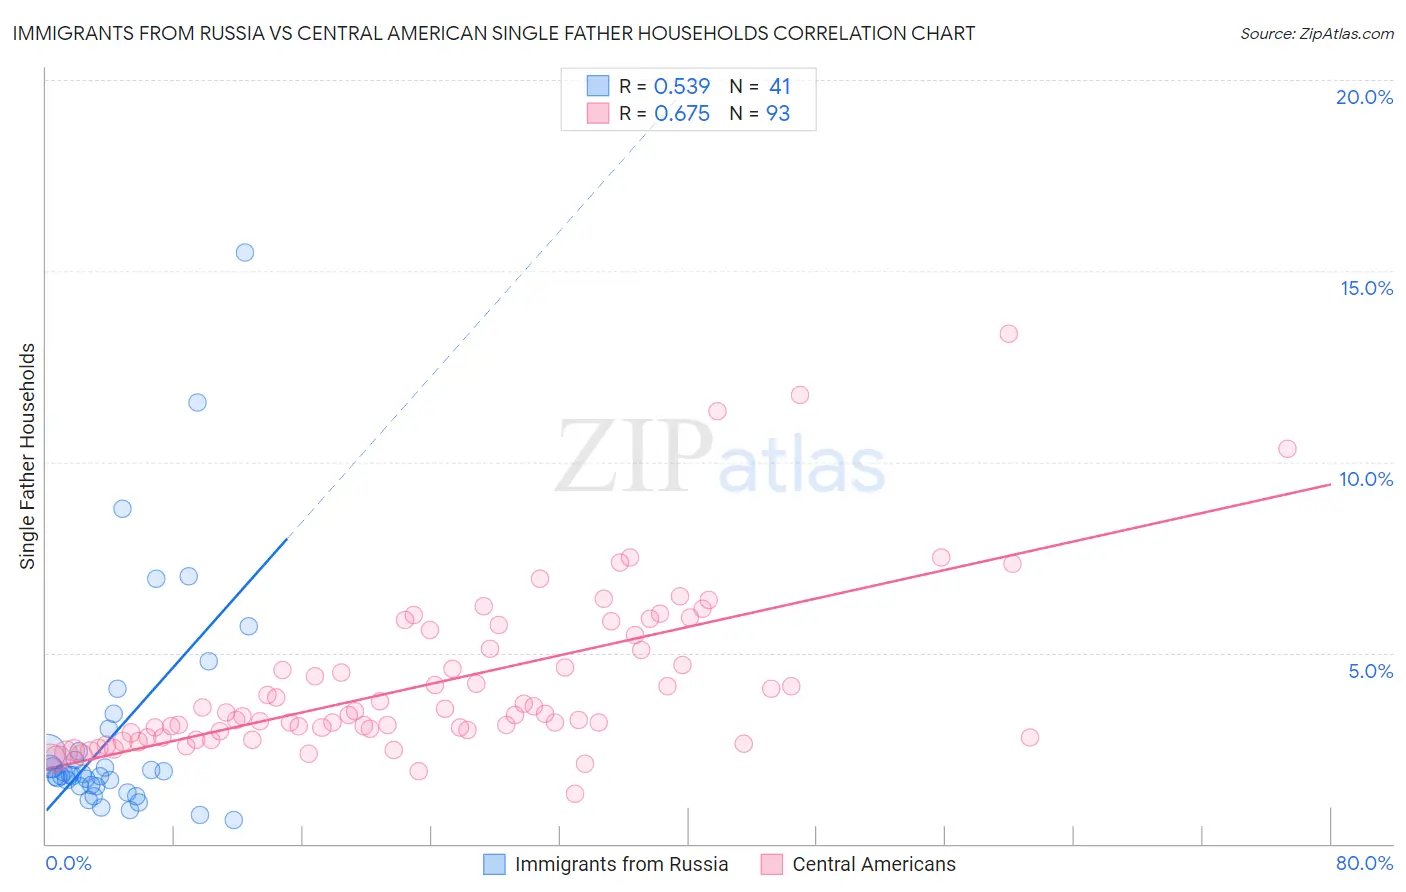
Immigrants from Russia vs Central American Single Father Households Correlation Chart
The statistical analysis conducted on geographies consisting of 345,238,184 people shows a substantial positive correlation between the proportion of Immigrants from Russia and percentage of single father households in the United States with a correlation coefficient (R) of 0.539 and weighted average of 2.0%. Similarly, the statistical analysis conducted on geographies consisting of 497,759,507 people shows a significant positive correlation between the proportion of Central Americans and percentage of single father households in the United States with a correlation coefficient (R) of 0.675 and weighted average of 2.9%, a difference of 45.9%.
Single Father Households Correlation Summary
| Measurement | Immigrants from Russia | Central American |
| Minimum | 0.62% | 1.3% |
| Maximum | 15.5% | 13.4% |
| Range | 14.8% | 12.0% |
| Mean | 2.9% | 4.2% |
| Median | 1.8% | 3.4% |
| Interquartile 25% (IQ1) | 1.5% | 2.8% |
| Interquartile 75% (IQ3) | 2.7% | 5.3% |
| Interquartile Range (IQR) | 1.2% | 2.5% |
| Standard Deviation (Sample) | 3.0% | 2.2% |
| Standard Deviation (Population) | 3.0% | 2.2% |
Similar Demographics by Single Father Households
Demographics Similar to Immigrants from Russia by Single Father Households
In terms of single father households, the demographic groups most similar to Immigrants from Russia are Immigrants from Croatia (2.0%, a difference of 0.0%), Eastern European (2.0%, a difference of 0.0%), Assyrian/Chaldean/Syriac (2.0%, a difference of 0.15%), Immigrants from South Central Asia (2.0%, a difference of 0.43%), and Immigrants from Japan (2.0%, a difference of 0.61%).
| Demographics | Rating | Rank | Single Father Households |
| Immigrants | India | 100.0 /100 | #17 | Exceptional 1.9% |
| Indians (Asian) | 100.0 /100 | #18 | Exceptional 1.9% |
| Iranians | 100.0 /100 | #19 | Exceptional 1.9% |
| Thais | 100.0 /100 | #20 | Exceptional 1.9% |
| Immigrants | Albania | 100.0 /100 | #21 | Exceptional 1.9% |
| Immigrants | Latvia | 100.0 /100 | #22 | Exceptional 1.9% |
| Immigrants | Croatia | 100.0 /100 | #23 | Exceptional 2.0% |
| Immigrants | Russia | 100.0 /100 | #24 | Exceptional 2.0% |
| Eastern Europeans | 100.0 /100 | #25 | Exceptional 2.0% |
| Assyrians/Chaldeans/Syriacs | 100.0 /100 | #26 | Exceptional 2.0% |
| Immigrants | South Central Asia | 100.0 /100 | #27 | Exceptional 2.0% |
| Immigrants | Japan | 100.0 /100 | #28 | Exceptional 2.0% |
| Bulgarians | 100.0 /100 | #29 | Exceptional 2.0% |
| Cambodians | 100.0 /100 | #30 | Exceptional 2.0% |
| Israelis | 100.0 /100 | #31 | Exceptional 2.0% |
Demographics Similar to Central Americans by Single Father Households
In terms of single father households, the demographic groups most similar to Central Americans are Immigrants from Laos (2.9%, a difference of 0.21%), Spanish American Indian (2.9%, a difference of 0.69%), Apache (2.8%, a difference of 0.71%), Hopi (2.8%, a difference of 0.89%), and Immigrants from the Azores (2.8%, a difference of 1.1%).
| Demographics | Rating | Rank | Single Father Households |
| Spanish Americans | 0.0 /100 | #302 | Tragic 2.8% |
| Immigrants | Honduras | 0.0 /100 | #303 | Tragic 2.8% |
| Mexican American Indians | 0.0 /100 | #304 | Tragic 2.8% |
| Hispanics or Latinos | 0.0 /100 | #305 | Tragic 2.8% |
| Immigrants | Azores | 0.0 /100 | #306 | Tragic 2.8% |
| Hopi | 0.0 /100 | #307 | Tragic 2.8% |
| Apache | 0.0 /100 | #308 | Tragic 2.8% |
| Central Americans | 0.0 /100 | #309 | Tragic 2.9% |
| Immigrants | Laos | 0.0 /100 | #310 | Tragic 2.9% |
| Spanish American Indians | 0.0 /100 | #311 | Tragic 2.9% |
| Tsimshian | 0.0 /100 | #312 | Tragic 2.9% |
| Arapaho | 0.0 /100 | #313 | Tragic 2.9% |
| Salvadorans | 0.0 /100 | #314 | Tragic 2.9% |
| Cheyenne | 0.0 /100 | #315 | Tragic 2.9% |
| Houma | 0.0 /100 | #316 | Tragic 2.9% |