Carpatho Rusyn vs Pennsylvania German Single Father Households
COMPARE
Carpatho Rusyn
Pennsylvania German
Single Father Households
Single Father Households Comparison
Carpatho Rusyns
Pennsylvania Germans
2.1%
SINGLE FATHER HOUSEHOLDS
99.6/ 100
METRIC RATING
84th/ 347
METRIC RANK
2.4%
SINGLE FATHER HOUSEHOLDS
7.3/ 100
METRIC RATING
232nd/ 347
METRIC RANK
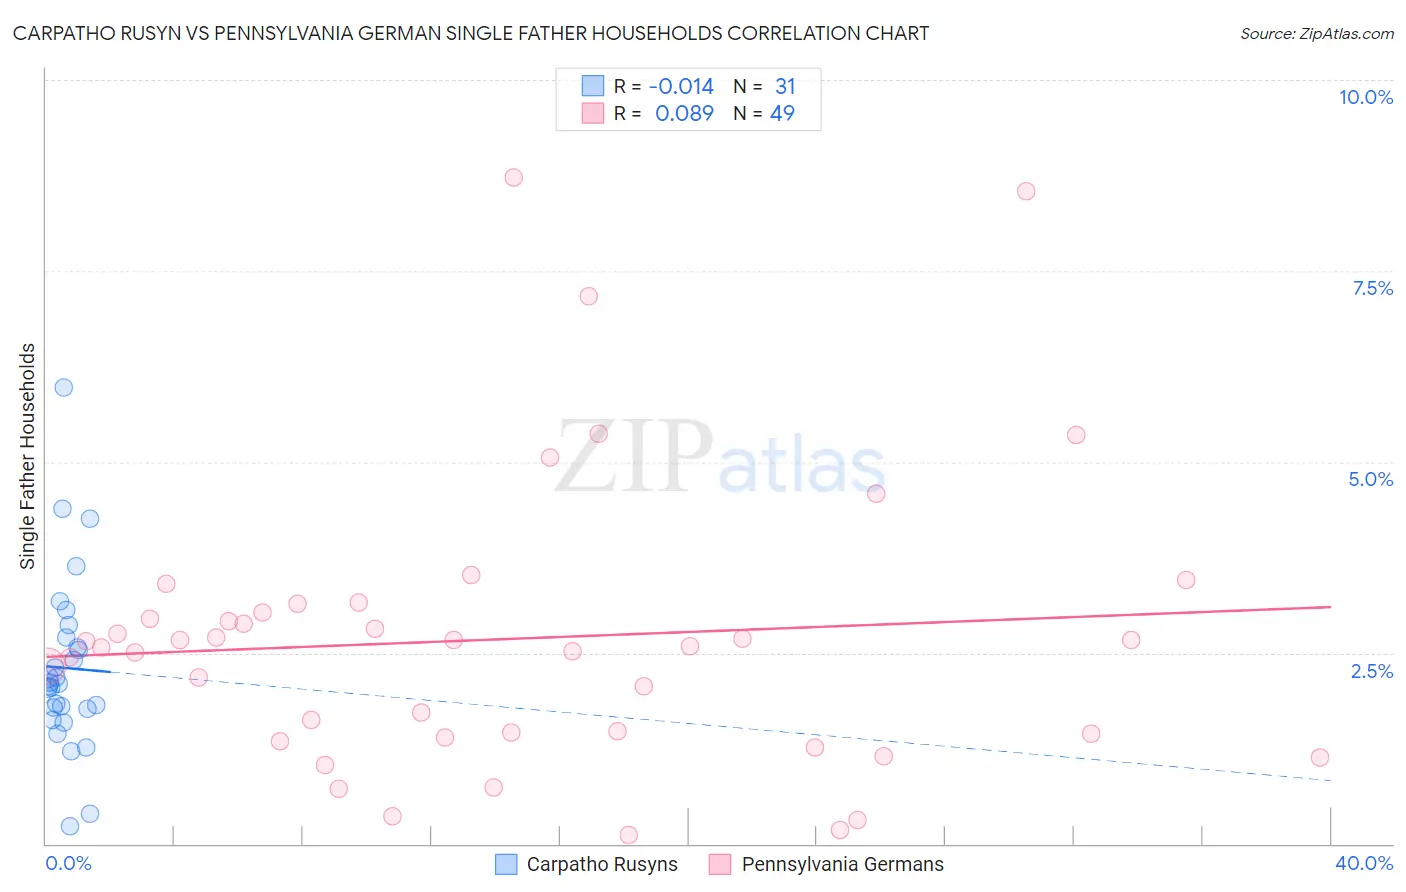
Carpatho Rusyn vs Pennsylvania German Single Father Households Correlation Chart
The statistical analysis conducted on geographies consisting of 58,690,125 people shows no correlation between the proportion of Carpatho Rusyns and percentage of single father households in the United States with a correlation coefficient (R) of -0.014 and weighted average of 2.1%. Similarly, the statistical analysis conducted on geographies consisting of 232,007,868 people shows a slight positive correlation between the proportion of Pennsylvania Germans and percentage of single father households in the United States with a correlation coefficient (R) of 0.089 and weighted average of 2.4%, a difference of 16.7%.
Single Father Households Correlation Summary
| Measurement | Carpatho Rusyn | Pennsylvania German |
| Minimum | 0.23% | 0.11% |
| Maximum | 6.0% | 8.7% |
| Range | 5.7% | 8.6% |
| Mean | 2.3% | 2.7% |
| Median | 2.1% | 2.6% |
| Interquartile 25% (IQ1) | 1.8% | 1.4% |
| Interquartile 75% (IQ3) | 2.7% | 3.1% |
| Interquartile Range (IQR) | 0.93% | 1.7% |
| Standard Deviation (Sample) | 1.1% | 1.9% |
| Standard Deviation (Population) | 1.1% | 1.9% |
Similar Demographics by Single Father Households
Demographics Similar to Carpatho Rusyns by Single Father Households
In terms of single father households, the demographic groups most similar to Carpatho Rusyns are Immigrants from Hungary (2.1%, a difference of 0.040%), Asian (2.1%, a difference of 0.12%), Greek (2.1%, a difference of 0.30%), New Zealander (2.1%, a difference of 0.31%), and Armenian (2.1%, a difference of 0.36%).
| Demographics | Rating | Rank | Single Father Households |
| Immigrants | Saudi Arabia | 99.8 /100 | #77 | Exceptional 2.1% |
| Estonians | 99.7 /100 | #78 | Exceptional 2.1% |
| Immigrants | Asia | 99.7 /100 | #79 | Exceptional 2.1% |
| Immigrants | South Africa | 99.7 /100 | #80 | Exceptional 2.1% |
| Armenians | 99.7 /100 | #81 | Exceptional 2.1% |
| New Zealanders | 99.7 /100 | #82 | Exceptional 2.1% |
| Greeks | 99.7 /100 | #83 | Exceptional 2.1% |
| Carpatho Rusyns | 99.6 /100 | #84 | Exceptional 2.1% |
| Immigrants | Hungary | 99.6 /100 | #85 | Exceptional 2.1% |
| Asians | 99.6 /100 | #86 | Exceptional 2.1% |
| Lithuanians | 99.5 /100 | #87 | Exceptional 2.1% |
| Bhutanese | 99.5 /100 | #88 | Exceptional 2.1% |
| Immigrants | Armenia | 99.5 /100 | #89 | Exceptional 2.1% |
| Immigrants | Pakistan | 99.5 /100 | #90 | Exceptional 2.1% |
| Immigrants | Guyana | 99.4 /100 | #91 | Exceptional 2.1% |
Demographics Similar to Pennsylvania Germans by Single Father Households
In terms of single father households, the demographic groups most similar to Pennsylvania Germans are Immigrants from Western Africa (2.4%, a difference of 0.060%), Nonimmigrants (2.4%, a difference of 0.080%), Subsaharan African (2.4%, a difference of 0.25%), African (2.5%, a difference of 0.26%), and Immigrants (2.5%, a difference of 0.28%).
| Demographics | Rating | Rank | Single Father Households |
| Marshallese | 9.7 /100 | #225 | Tragic 2.4% |
| Blacks/African Americans | 9.7 /100 | #226 | Tragic 2.4% |
| Americans | 9.3 /100 | #227 | Tragic 2.4% |
| Immigrants | Ghana | 9.1 /100 | #228 | Tragic 2.4% |
| Immigrants | Zaire | 8.6 /100 | #229 | Tragic 2.4% |
| Sub-Saharan Africans | 8.3 /100 | #230 | Tragic 2.4% |
| Immigrants | Nonimmigrants | 7.6 /100 | #231 | Tragic 2.4% |
| Pennsylvania Germans | 7.3 /100 | #232 | Tragic 2.4% |
| Immigrants | Western Africa | 7.0 /100 | #233 | Tragic 2.4% |
| Africans | 6.3 /100 | #234 | Tragic 2.5% |
| Immigrants | Immigrants | 6.3 /100 | #235 | Tragic 2.5% |
| Cajuns | 6.1 /100 | #236 | Tragic 2.5% |
| Sierra Leoneans | 5.9 /100 | #237 | Tragic 2.5% |
| Immigrants | Sierra Leone | 5.8 /100 | #238 | Tragic 2.5% |
| Immigrants | Oceania | 5.8 /100 | #239 | Tragic 2.5% |