Bermudan vs Pennsylvania German Single Father Households
COMPARE
Bermudan
Pennsylvania German
Single Father Households
Single Father Households Comparison
Bermudans
Pennsylvania Germans
2.1%
SINGLE FATHER HOUSEHOLDS
99.2/ 100
METRIC RATING
95th/ 347
METRIC RANK
2.4%
SINGLE FATHER HOUSEHOLDS
7.3/ 100
METRIC RATING
232nd/ 347
METRIC RANK
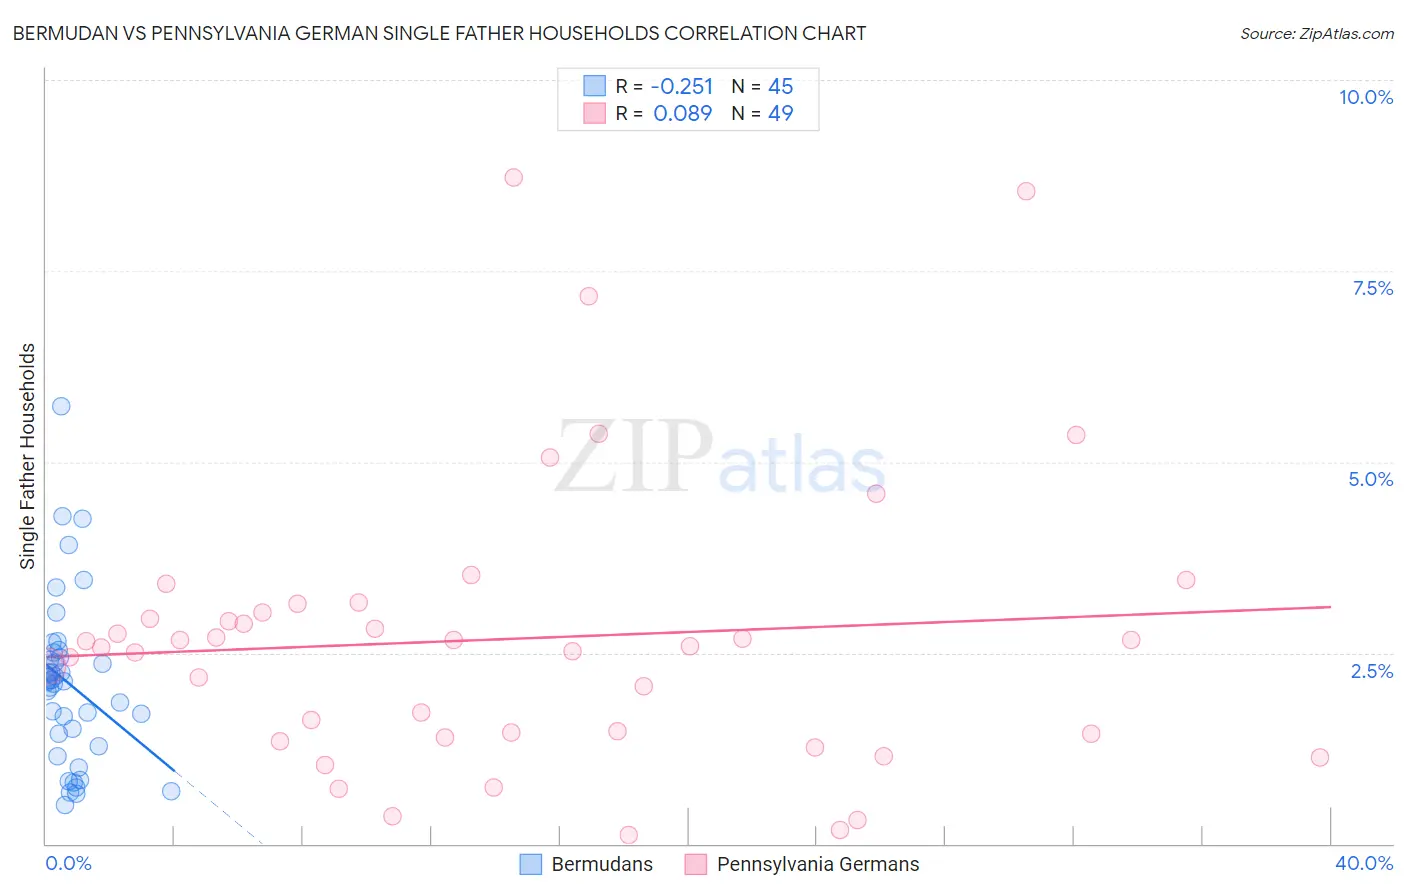
Bermudan vs Pennsylvania German Single Father Households Correlation Chart
The statistical analysis conducted on geographies consisting of 55,647,509 people shows a weak negative correlation between the proportion of Bermudans and percentage of single father households in the United States with a correlation coefficient (R) of -0.251 and weighted average of 2.1%. Similarly, the statistical analysis conducted on geographies consisting of 232,007,868 people shows a slight positive correlation between the proportion of Pennsylvania Germans and percentage of single father households in the United States with a correlation coefficient (R) of 0.089 and weighted average of 2.4%, a difference of 15.0%.
Single Father Households Correlation Summary
| Measurement | Bermudan | Pennsylvania German |
| Minimum | 0.51% | 0.11% |
| Maximum | 5.7% | 8.7% |
| Range | 5.2% | 8.6% |
| Mean | 2.1% | 2.7% |
| Median | 2.1% | 2.6% |
| Interquartile 25% (IQ1) | 1.4% | 1.4% |
| Interquartile 75% (IQ3) | 2.5% | 3.1% |
| Interquartile Range (IQR) | 1.1% | 1.7% |
| Standard Deviation (Sample) | 1.1% | 1.9% |
| Standard Deviation (Population) | 1.1% | 1.9% |
Similar Demographics by Single Father Households
Demographics Similar to Bermudans by Single Father Households
In terms of single father households, the demographic groups most similar to Bermudans are Arab (2.1%, a difference of 0.14%), Ukrainian (2.1%, a difference of 0.22%), Croatian (2.1%, a difference of 0.23%), Immigrants from Moldova (2.1%, a difference of 0.27%), and Romanian (2.1%, a difference of 0.33%).
| Demographics | Rating | Rank | Single Father Households |
| Bhutanese | 99.5 /100 | #88 | Exceptional 2.1% |
| Immigrants | Armenia | 99.5 /100 | #89 | Exceptional 2.1% |
| Immigrants | Pakistan | 99.5 /100 | #90 | Exceptional 2.1% |
| Immigrants | Guyana | 99.4 /100 | #91 | Exceptional 2.1% |
| Romanians | 99.4 /100 | #92 | Exceptional 2.1% |
| Croatians | 99.3 /100 | #93 | Exceptional 2.1% |
| Ukrainians | 99.3 /100 | #94 | Exceptional 2.1% |
| Bermudans | 99.2 /100 | #95 | Exceptional 2.1% |
| Arabs | 99.2 /100 | #96 | Exceptional 2.1% |
| Immigrants | Moldova | 99.1 /100 | #97 | Exceptional 2.1% |
| Guyanese | 99.1 /100 | #98 | Exceptional 2.1% |
| South Africans | 99.1 /100 | #99 | Exceptional 2.1% |
| Immigrants | Northern Africa | 99.0 /100 | #100 | Exceptional 2.1% |
| Immigrants | Western Europe | 98.9 /100 | #101 | Exceptional 2.1% |
| Argentineans | 98.9 /100 | #102 | Exceptional 2.1% |
Demographics Similar to Pennsylvania Germans by Single Father Households
In terms of single father households, the demographic groups most similar to Pennsylvania Germans are Immigrants from Western Africa (2.4%, a difference of 0.060%), Nonimmigrants (2.4%, a difference of 0.080%), Subsaharan African (2.4%, a difference of 0.25%), African (2.5%, a difference of 0.26%), and Immigrants (2.5%, a difference of 0.28%).
| Demographics | Rating | Rank | Single Father Households |
| Marshallese | 9.7 /100 | #225 | Tragic 2.4% |
| Blacks/African Americans | 9.7 /100 | #226 | Tragic 2.4% |
| Americans | 9.3 /100 | #227 | Tragic 2.4% |
| Immigrants | Ghana | 9.1 /100 | #228 | Tragic 2.4% |
| Immigrants | Zaire | 8.6 /100 | #229 | Tragic 2.4% |
| Sub-Saharan Africans | 8.3 /100 | #230 | Tragic 2.4% |
| Immigrants | Nonimmigrants | 7.6 /100 | #231 | Tragic 2.4% |
| Pennsylvania Germans | 7.3 /100 | #232 | Tragic 2.4% |
| Immigrants | Western Africa | 7.0 /100 | #233 | Tragic 2.4% |
| Africans | 6.3 /100 | #234 | Tragic 2.5% |
| Immigrants | Immigrants | 6.3 /100 | #235 | Tragic 2.5% |
| Cajuns | 6.1 /100 | #236 | Tragic 2.5% |
| Sierra Leoneans | 5.9 /100 | #237 | Tragic 2.5% |
| Immigrants | Sierra Leone | 5.8 /100 | #238 | Tragic 2.5% |
| Immigrants | Oceania | 5.8 /100 | #239 | Tragic 2.5% |