Carpatho Rusyn vs Immigrants from Senegal No Schooling Completed
COMPARE
Carpatho Rusyn
Immigrants from Senegal
No Schooling Completed
No Schooling Completed Comparison
Carpatho Rusyns
Immigrants from Senegal
1.4%
NO SCHOOLING COMPLETED
100.0/ 100
METRIC RATING
6th/ 347
METRIC RANK
2.4%
NO SCHOOLING COMPLETED
1.7/ 100
METRIC RATING
240th/ 347
METRIC RANK
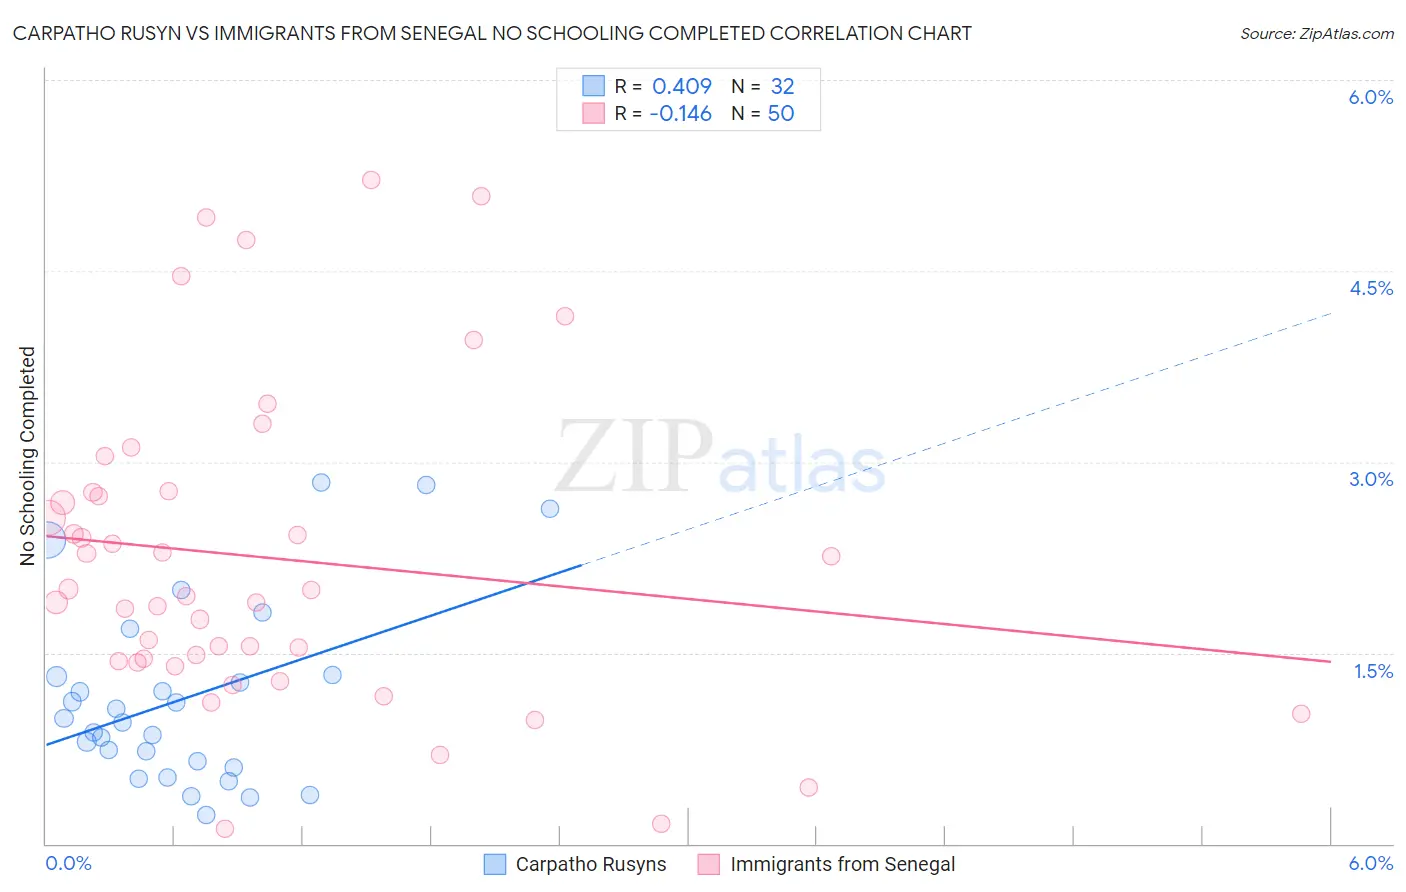
Carpatho Rusyn vs Immigrants from Senegal No Schooling Completed Correlation Chart
The statistical analysis conducted on geographies consisting of 58,721,636 people shows a moderate positive correlation between the proportion of Carpatho Rusyns and percentage of population with no schooling in the United States with a correlation coefficient (R) of 0.409 and weighted average of 1.4%. Similarly, the statistical analysis conducted on geographies consisting of 90,026,506 people shows a poor negative correlation between the proportion of Immigrants from Senegal and percentage of population with no schooling in the United States with a correlation coefficient (R) of -0.146 and weighted average of 2.4%, a difference of 73.1%.
No Schooling Completed Correlation Summary
| Measurement | Carpatho Rusyn | Immigrants from Senegal |
| Minimum | 0.23% | 0.12% |
| Maximum | 2.8% | 5.2% |
| Range | 2.6% | 5.1% |
| Mean | 1.1% | 2.2% |
| Median | 0.97% | 2.0% |
| Interquartile 25% (IQ1) | 0.62% | 1.4% |
| Interquartile 75% (IQ3) | 1.3% | 2.8% |
| Interquartile Range (IQR) | 0.70% | 1.3% |
| Standard Deviation (Sample) | 0.72% | 1.2% |
| Standard Deviation (Population) | 0.71% | 1.2% |
Similar Demographics by No Schooling Completed
Demographics Similar to Carpatho Rusyns by No Schooling Completed
In terms of no schooling completed, the demographic groups most similar to Carpatho Rusyns are Slovene (1.4%, a difference of 0.82%), English (1.4%, a difference of 0.97%), German (1.4%, a difference of 1.2%), Norwegian (1.3%, a difference of 1.8%), and Slovak (1.3%, a difference of 2.2%).
| Demographics | Rating | Rank | No Schooling Completed |
| Yup'ik | 100.0 /100 | #1 | Exceptional 1.2% |
| Slovaks | 100.0 /100 | #2 | Exceptional 1.3% |
| Norwegians | 100.0 /100 | #3 | Exceptional 1.3% |
| Germans | 100.0 /100 | #4 | Exceptional 1.4% |
| Slovenes | 100.0 /100 | #5 | Exceptional 1.4% |
| Carpatho Rusyns | 100.0 /100 | #6 | Exceptional 1.4% |
| English | 100.0 /100 | #7 | Exceptional 1.4% |
| Swedes | 100.0 /100 | #8 | Exceptional 1.4% |
| Scottish | 100.0 /100 | #9 | Exceptional 1.4% |
| Dutch | 100.0 /100 | #10 | Exceptional 1.4% |
| Lithuanians | 100.0 /100 | #11 | Exceptional 1.4% |
| Irish | 100.0 /100 | #12 | Exceptional 1.4% |
| Poles | 100.0 /100 | #13 | Exceptional 1.4% |
| Scotch-Irish | 100.0 /100 | #14 | Exceptional 1.5% |
| Tlingit-Haida | 100.0 /100 | #15 | Exceptional 1.5% |
Demographics Similar to Immigrants from Senegal by No Schooling Completed
In terms of no schooling completed, the demographic groups most similar to Immigrants from Senegal are Korean (2.4%, a difference of 0.060%), Liberian (2.4%, a difference of 0.23%), Paiute (2.4%, a difference of 0.35%), Immigrants from Indonesia (2.4%, a difference of 0.38%), and South American (2.4%, a difference of 0.42%).
| Demographics | Rating | Rank | No Schooling Completed |
| Immigrants | Malaysia | 2.8 /100 | #233 | Tragic 2.3% |
| Nigerians | 2.6 /100 | #234 | Tragic 2.3% |
| Immigrants | Western Asia | 2.6 /100 | #235 | Tragic 2.3% |
| Iraqis | 2.2 /100 | #236 | Tragic 2.4% |
| Immigrants | Eastern Asia | 2.0 /100 | #237 | Tragic 2.4% |
| Paiute | 1.9 /100 | #238 | Tragic 2.4% |
| Liberians | 1.8 /100 | #239 | Tragic 2.4% |
| Immigrants | Senegal | 1.7 /100 | #240 | Tragic 2.4% |
| Koreans | 1.7 /100 | #241 | Tragic 2.4% |
| Immigrants | Indonesia | 1.5 /100 | #242 | Tragic 2.4% |
| South Americans | 1.5 /100 | #243 | Tragic 2.4% |
| Peruvians | 1.4 /100 | #244 | Tragic 2.4% |
| Bolivians | 1.4 /100 | #245 | Tragic 2.4% |
| Immigrants | Congo | 1.4 /100 | #246 | Tragic 2.4% |
| Immigrants | Iraq | 1.3 /100 | #247 | Tragic 2.4% |