Carpatho Rusyn vs Assyrian/Chaldean/Syriac Unemployment Among Ages 65 to 74 years
COMPARE
Carpatho Rusyn
Assyrian/Chaldean/Syriac
Unemployment Among Ages 65 to 74 years
Unemployment Among Ages 65 to 74 years Comparison
Carpatho Rusyns
Assyrians/Chaldeans/Syriacs
5.1%
UNEMPLOYMENT AMONG AGES 65 TO 74 YEARS
99.6/ 100
METRIC RATING
55th/ 347
METRIC RANK
5.1%
UNEMPLOYMENT AMONG AGES 65 TO 74 YEARS
99.9/ 100
METRIC RATING
43rd/ 347
METRIC RANK
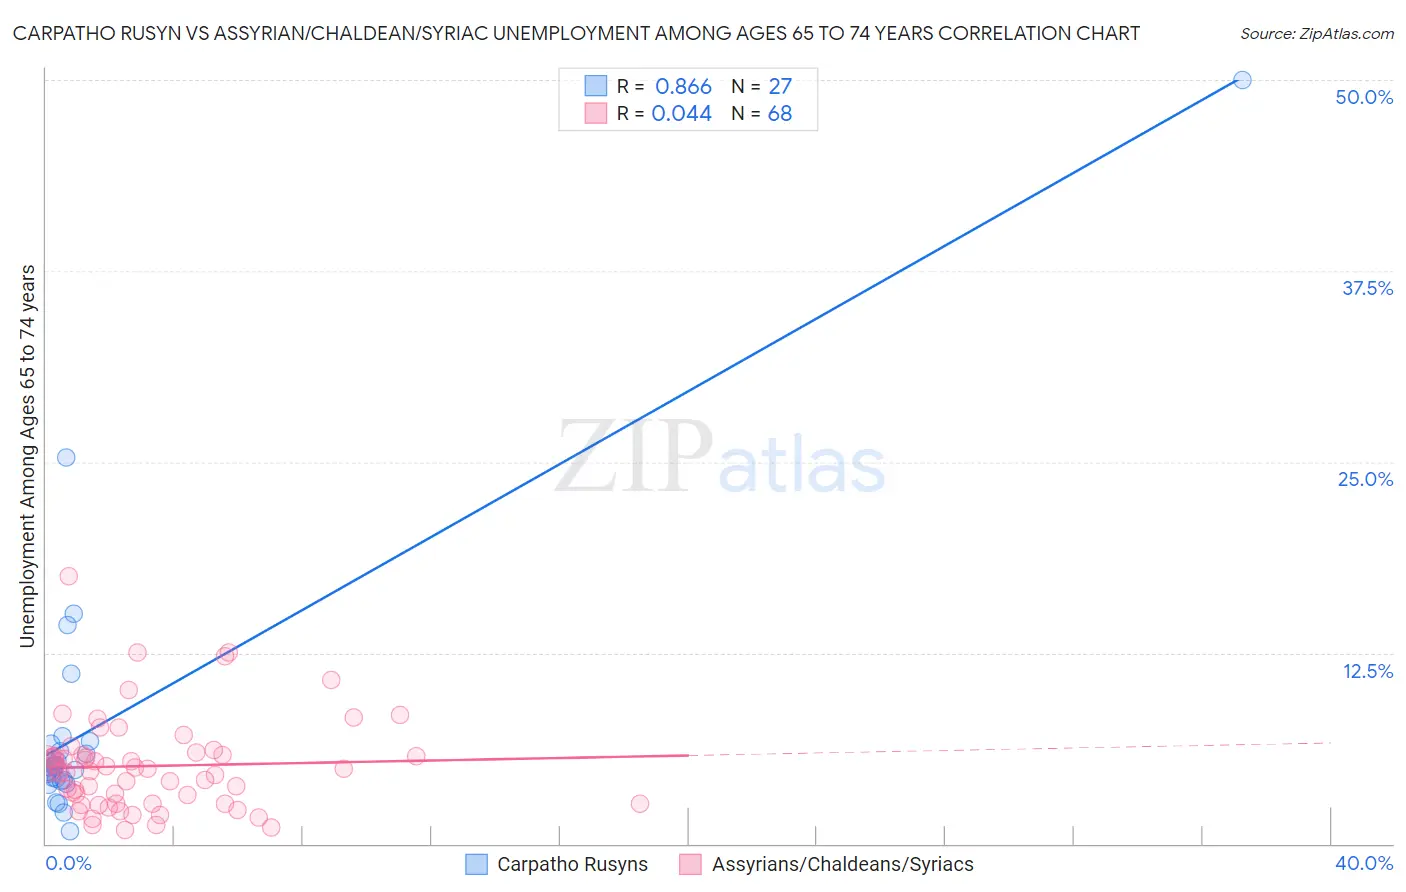
Carpatho Rusyn vs Assyrian/Chaldean/Syriac Unemployment Among Ages 65 to 74 years Correlation Chart
The statistical analysis conducted on geographies consisting of 56,803,186 people shows a very strong positive correlation between the proportion of Carpatho Rusyns and unemployment rate among population between the ages 65 and 74 in the United States with a correlation coefficient (R) of 0.866 and weighted average of 5.1%. Similarly, the statistical analysis conducted on geographies consisting of 106,069,600 people shows no correlation between the proportion of Assyrians/Chaldeans/Syriacs and unemployment rate among population between the ages 65 and 74 in the United States with a correlation coefficient (R) of 0.044 and weighted average of 5.1%, a difference of 1.1%.
Unemployment Among Ages 65 to 74 years Correlation Summary
| Measurement | Carpatho Rusyn | Assyrian/Chaldean/Syriac |
| Minimum | 0.80% | 0.90% |
| Maximum | 50.0% | 17.5% |
| Range | 49.2% | 16.6% |
| Mean | 8.0% | 5.1% |
| Median | 5.0% | 4.8% |
| Interquartile 25% (IQ1) | 4.1% | 2.6% |
| Interquartile 75% (IQ3) | 6.7% | 5.8% |
| Interquartile Range (IQR) | 2.6% | 3.2% |
| Standard Deviation (Sample) | 9.8% | 3.1% |
| Standard Deviation (Population) | 9.6% | 3.1% |
Demographics Similar to Carpatho Rusyns and Assyrians/Chaldeans/Syriacs by Unemployment Among Ages 65 to 74 years
In terms of unemployment among ages 65 to 74 years, the demographic groups most similar to Carpatho Rusyns are Swedish (5.1%, a difference of 0.080%), Croatian (5.1%, a difference of 0.080%), Immigrants from Nicaragua (5.1%, a difference of 0.090%), Immigrants from Ethiopia (5.1%, a difference of 0.11%), and European (5.1%, a difference of 0.12%). Similarly, the demographic groups most similar to Assyrians/Chaldeans/Syriacs are Immigrants from India (5.1%, a difference of 0.090%), Jordanian (5.1%, a difference of 0.12%), Sioux (5.1%, a difference of 0.20%), Ugandan (5.1%, a difference of 0.27%), and Immigrants from Iraq (5.1%, a difference of 0.28%).
| Demographics | Rating | Rank | Unemployment Among Ages 65 to 74 years |
| Immigrants | Sweden | 99.9 /100 | #39 | Exceptional 5.0% |
| Immigrants | Iraq | 99.9 /100 | #40 | Exceptional 5.1% |
| Ugandans | 99.9 /100 | #41 | Exceptional 5.1% |
| Jordanians | 99.9 /100 | #42 | Exceptional 5.1% |
| Assyrians/Chaldeans/Syriacs | 99.9 /100 | #43 | Exceptional 5.1% |
| Immigrants | India | 99.9 /100 | #44 | Exceptional 5.1% |
| Sioux | 99.8 /100 | #45 | Exceptional 5.1% |
| Immigrants | Kenya | 99.8 /100 | #46 | Exceptional 5.1% |
| Immigrants | Uganda | 99.8 /100 | #47 | Exceptional 5.1% |
| Choctaw | 99.8 /100 | #48 | Exceptional 5.1% |
| Immigrants | Austria | 99.8 /100 | #49 | Exceptional 5.1% |
| Immigrants | Zimbabwe | 99.7 /100 | #50 | Exceptional 5.1% |
| Immigrants | Kazakhstan | 99.7 /100 | #51 | Exceptional 5.1% |
| Europeans | 99.6 /100 | #52 | Exceptional 5.1% |
| Immigrants | Ethiopia | 99.6 /100 | #53 | Exceptional 5.1% |
| Immigrants | Nicaragua | 99.6 /100 | #54 | Exceptional 5.1% |
| Carpatho Rusyns | 99.6 /100 | #55 | Exceptional 5.1% |
| Swedes | 99.5 /100 | #56 | Exceptional 5.1% |
| Croatians | 99.5 /100 | #57 | Exceptional 5.1% |
| Germans | 99.5 /100 | #58 | Exceptional 5.1% |
| Immigrants | Bulgaria | 99.4 /100 | #59 | Exceptional 5.1% |