Cape Verdean vs Immigrants from Indonesia Average Family Size
COMPARE
Cape Verdean
Immigrants from Indonesia
Average Family Size
Average Family Size Comparison
Cape Verdeans
Immigrants from Indonesia
3.17
AVERAGE FAMILY SIZE
1.6/ 100
METRIC RATING
255th/ 347
METRIC RANK
3.27
AVERAGE FAMILY SIZE
93.7/ 100
METRIC RATING
119th/ 347
METRIC RANK
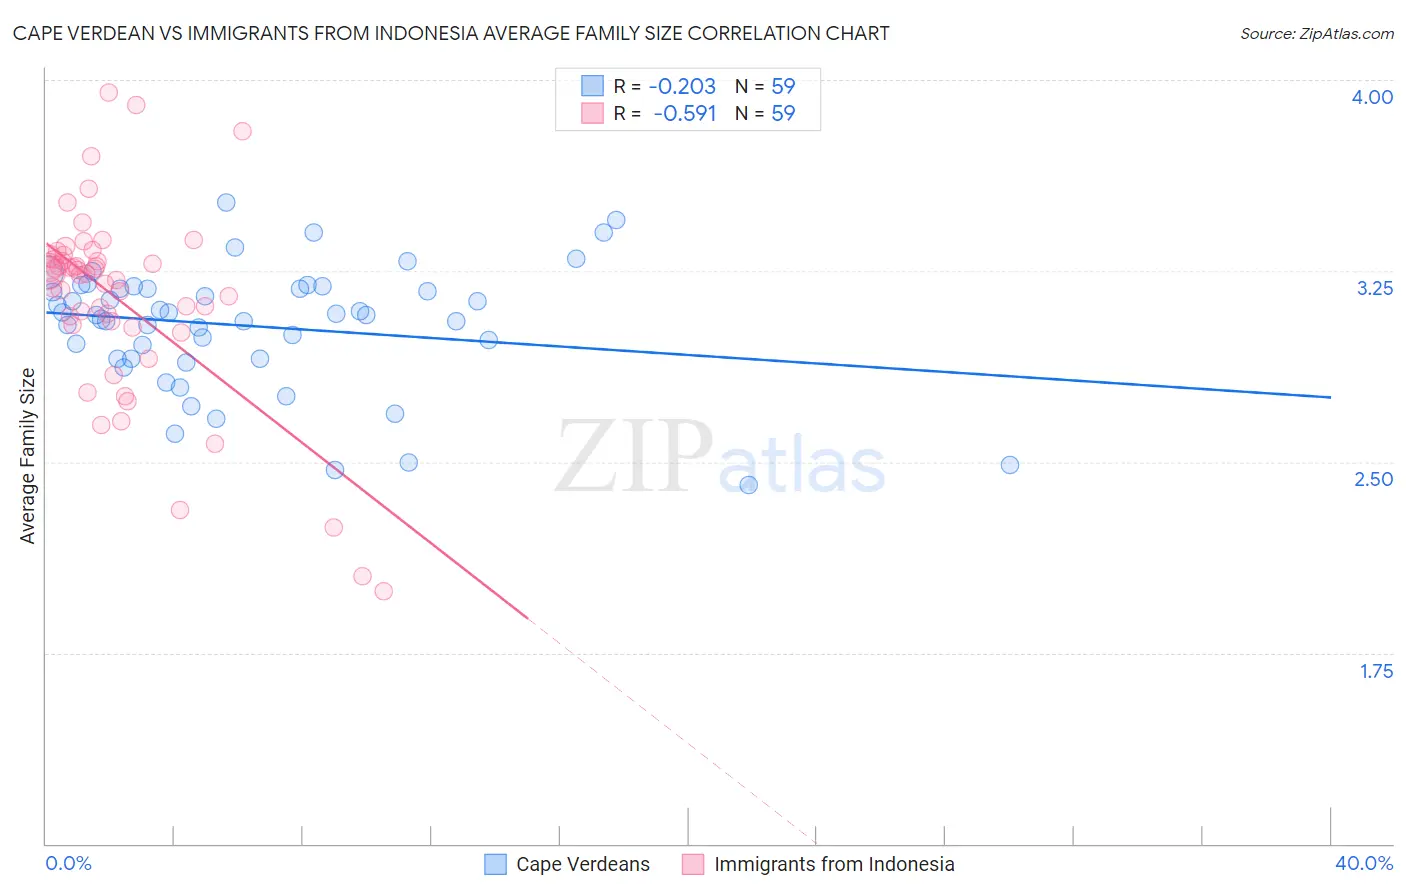
Cape Verdean vs Immigrants from Indonesia Average Family Size Correlation Chart
The statistical analysis conducted on geographies consisting of 107,550,345 people shows a weak negative correlation between the proportion of Cape Verdeans and average family size in the United States with a correlation coefficient (R) of -0.203 and weighted average of 3.17. Similarly, the statistical analysis conducted on geographies consisting of 215,720,751 people shows a substantial negative correlation between the proportion of Immigrants from Indonesia and average family size in the United States with a correlation coefficient (R) of -0.591 and weighted average of 3.27, a difference of 3.2%.
Average Family Size Correlation Summary
| Measurement | Cape Verdean | Immigrants from Indonesia |
| Minimum | 2.41 | 1.99 |
| Maximum | 3.52 | 3.95 |
| Range | 1.11 | 1.96 |
| Mean | 3.03 | 3.14 |
| Median | 3.08 | 3.24 |
| Interquartile 25% (IQ1) | 2.91 | 3.04 |
| Interquartile 75% (IQ3) | 3.18 | 3.31 |
| Interquartile Range (IQR) | 0.27 | 0.27 |
| Standard Deviation (Sample) | 0.24 | 0.38 |
| Standard Deviation (Population) | 0.24 | 0.38 |
Similar Demographics by Average Family Size
Demographics Similar to Cape Verdeans by Average Family Size
In terms of average family size, the demographic groups most similar to Cape Verdeans are Immigrants from Hungary (3.17, a difference of 0.010%), Immigrants from Saudi Arabia (3.17, a difference of 0.020%), South African (3.17, a difference of 0.020%), Immigrants from Kazakhstan (3.17, a difference of 0.030%), and Immigrants from Spain (3.17, a difference of 0.050%).
| Demographics | Rating | Rank | Average Family Size |
| Immigrants | Belarus | 2.3 /100 | #248 | Tragic 3.17 |
| Immigrants | Eastern Europe | 2.1 /100 | #249 | Tragic 3.17 |
| Puget Sound Salish | 1.9 /100 | #250 | Tragic 3.17 |
| Immigrants | Spain | 1.8 /100 | #251 | Tragic 3.17 |
| Immigrants | Saudi Arabia | 1.7 /100 | #252 | Tragic 3.17 |
| South Africans | 1.7 /100 | #253 | Tragic 3.17 |
| Immigrants | Hungary | 1.7 /100 | #254 | Tragic 3.17 |
| Cape Verdeans | 1.6 /100 | #255 | Tragic 3.17 |
| Immigrants | Kazakhstan | 1.5 /100 | #256 | Tragic 3.17 |
| Albanians | 1.5 /100 | #257 | Tragic 3.17 |
| Turks | 1.3 /100 | #258 | Tragic 3.16 |
| Potawatomi | 1.3 /100 | #259 | Tragic 3.16 |
| Immigrants | Albania | 1.3 /100 | #260 | Tragic 3.16 |
| Immigrants | North Macedonia | 1.3 /100 | #261 | Tragic 3.16 |
| Immigrants | Russia | 1.3 /100 | #262 | Tragic 3.16 |
Demographics Similar to Immigrants from Indonesia by Average Family Size
In terms of average family size, the demographic groups most similar to Immigrants from Indonesia are Immigrants from Bahamas (3.27, a difference of 0.010%), Immigrants from Asia (3.27, a difference of 0.020%), Immigrants from Thailand (3.27, a difference of 0.040%), Immigrants from Colombia (3.27, a difference of 0.070%), and Kiowa (3.27, a difference of 0.090%).
| Demographics | Rating | Rank | Average Family Size |
| Blacks/African Americans | 95.7 /100 | #112 | Exceptional 3.27 |
| Immigrants | Panama | 95.6 /100 | #113 | Exceptional 3.27 |
| South Americans | 95.1 /100 | #114 | Exceptional 3.27 |
| Immigrants | Liberia | 95.0 /100 | #115 | Exceptional 3.27 |
| Immigrants | South America | 95.0 /100 | #116 | Exceptional 3.27 |
| Kiowa | 94.8 /100 | #117 | Exceptional 3.27 |
| Immigrants | Asia | 94.0 /100 | #118 | Exceptional 3.27 |
| Immigrants | Indonesia | 93.7 /100 | #119 | Exceptional 3.27 |
| Immigrants | Bahamas | 93.6 /100 | #120 | Exceptional 3.27 |
| Immigrants | Thailand | 93.3 /100 | #121 | Exceptional 3.27 |
| Immigrants | Colombia | 92.8 /100 | #122 | Exceptional 3.27 |
| Alaskan Athabascans | 92.4 /100 | #123 | Exceptional 3.27 |
| South American Indians | 91.6 /100 | #124 | Exceptional 3.26 |
| Immigrants | Cuba | 91.3 /100 | #125 | Exceptional 3.26 |
| Immigrants | Costa Rica | 90.7 /100 | #126 | Exceptional 3.26 |