Cajun vs Seminole Currently Married
COMPARE
Cajun
Seminole
Currently Married
Currently Married Comparison
Cajuns
Seminole
47.1%
CURRENTLY MARRIED
75.3/ 100
METRIC RATING
140th/ 347
METRIC RANK
44.6%
CURRENTLY MARRIED
0.9/ 100
METRIC RATING
237th/ 347
METRIC RANK
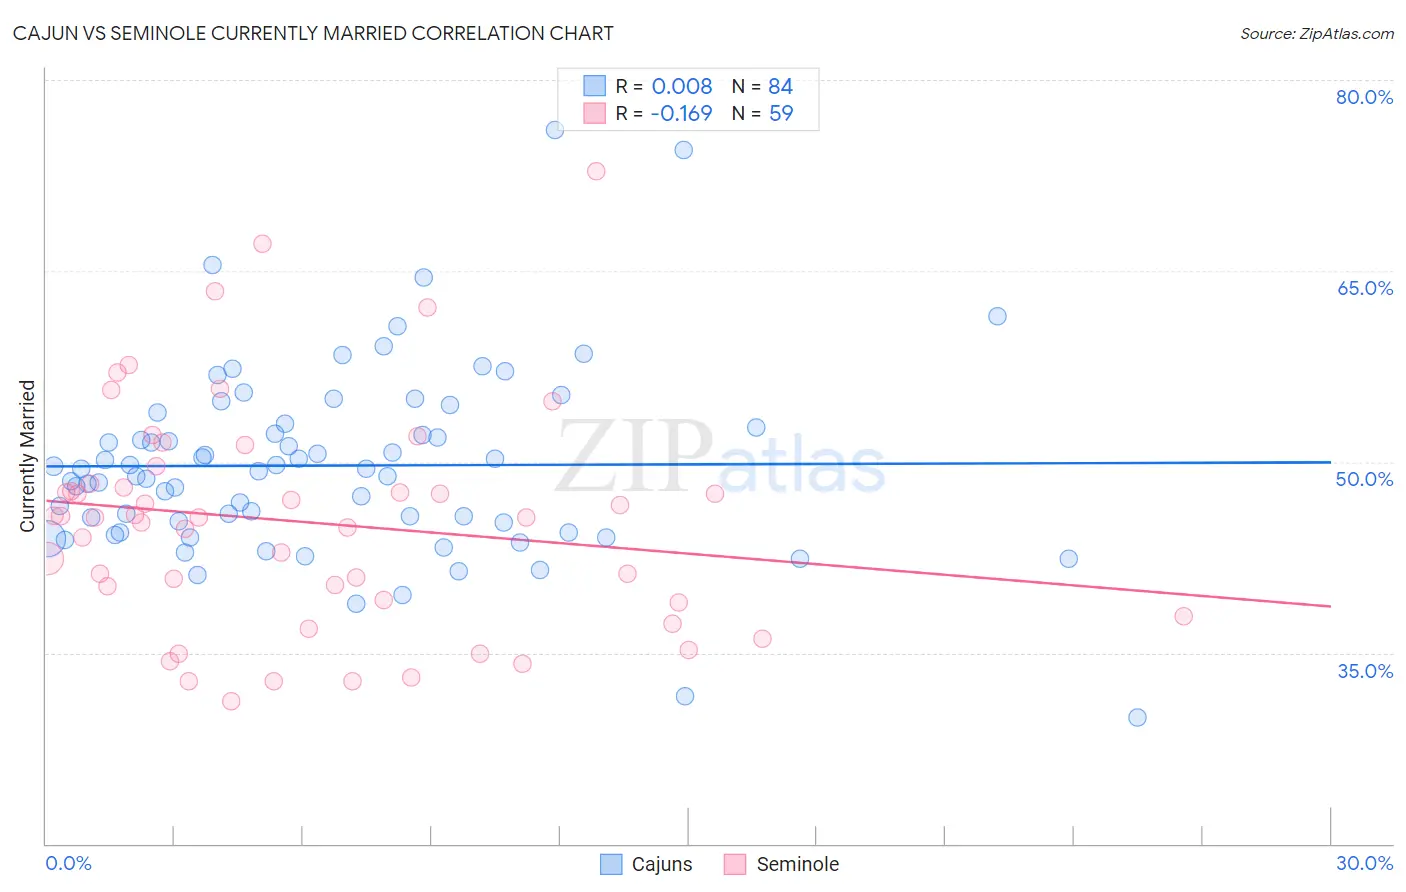
Cajun vs Seminole Currently Married Correlation Chart
The statistical analysis conducted on geographies consisting of 149,704,790 people shows no correlation between the proportion of Cajuns and percentage of population currently married in the United States with a correlation coefficient (R) of 0.008 and weighted average of 47.1%. Similarly, the statistical analysis conducted on geographies consisting of 118,313,136 people shows a poor negative correlation between the proportion of Seminole and percentage of population currently married in the United States with a correlation coefficient (R) of -0.169 and weighted average of 44.6%, a difference of 5.5%.
Currently Married Correlation Summary
| Measurement | Cajun | Seminole |
| Minimum | 29.9% | 31.2% |
| Maximum | 76.1% | 72.8% |
| Range | 46.2% | 41.6% |
| Mean | 49.7% | 45.3% |
| Median | 49.4% | 45.6% |
| Interquartile 25% (IQ1) | 44.9% | 39.0% |
| Interquartile 75% (IQ3) | 52.9% | 48.3% |
| Interquartile Range (IQR) | 8.0% | 9.3% |
| Standard Deviation (Sample) | 7.5% | 8.9% |
| Standard Deviation (Population) | 7.4% | 8.8% |
Similar Demographics by Currently Married
Demographics Similar to Cajuns by Currently Married
In terms of currently married, the demographic groups most similar to Cajuns are Venezuelan (47.1%, a difference of 0.040%), Argentinean (47.1%, a difference of 0.040%), Guamanian/Chamorro (47.1%, a difference of 0.050%), Hmong (47.1%, a difference of 0.090%), and Pakistani (47.2%, a difference of 0.11%).
| Demographics | Rating | Rank | Currently Married |
| Immigrants | Malaysia | 81.1 /100 | #133 | Excellent 47.3% |
| Immigrants | Australia | 81.1 /100 | #134 | Excellent 47.3% |
| Immigrants | Norway | 79.7 /100 | #135 | Good 47.2% |
| Immigrants | Vietnam | 78.2 /100 | #136 | Good 47.2% |
| Paraguayans | 77.8 /100 | #137 | Good 47.2% |
| Pakistanis | 77.5 /100 | #138 | Good 47.2% |
| Yugoslavians | 77.4 /100 | #139 | Good 47.2% |
| Cajuns | 75.3 /100 | #140 | Good 47.1% |
| Venezuelans | 74.4 /100 | #141 | Good 47.1% |
| Argentineans | 74.4 /100 | #142 | Good 47.1% |
| Guamanians/Chamorros | 74.2 /100 | #143 | Good 47.1% |
| Hmong | 73.4 /100 | #144 | Good 47.1% |
| Immigrants | South Eastern Asia | 72.9 /100 | #145 | Good 47.1% |
| Carpatho Rusyns | 72.6 /100 | #146 | Good 47.0% |
| Immigrants | Argentina | 72.0 /100 | #147 | Good 47.0% |
Demographics Similar to Seminole by Currently Married
In terms of currently married, the demographic groups most similar to Seminole are Cuban (44.6%, a difference of 0.0%), Alaskan Athabascan (44.6%, a difference of 0.010%), Moroccan (44.6%, a difference of 0.080%), Iroquois (44.7%, a difference of 0.17%), and Immigrants from Saudi Arabia (44.7%, a difference of 0.18%).
| Demographics | Rating | Rank | Currently Married |
| Immigrants | Kenya | 1.6 /100 | #230 | Tragic 44.9% |
| Immigrants | Panama | 1.5 /100 | #231 | Tragic 44.9% |
| Nepalese | 1.2 /100 | #232 | Tragic 44.7% |
| Immigrants | Saudi Arabia | 1.1 /100 | #233 | Tragic 44.7% |
| Iroquois | 1.1 /100 | #234 | Tragic 44.7% |
| Alaskan Athabascans | 0.9 /100 | #235 | Tragic 44.6% |
| Cubans | 0.9 /100 | #236 | Tragic 44.6% |
| Seminole | 0.9 /100 | #237 | Tragic 44.6% |
| Moroccans | 0.9 /100 | #238 | Tragic 44.6% |
| Immigrants | Mexico | 0.7 /100 | #239 | Tragic 44.5% |
| Mexican American Indians | 0.7 /100 | #240 | Tragic 44.5% |
| Ethiopians | 0.7 /100 | #241 | Tragic 44.5% |
| Immigrants | Cambodia | 0.7 /100 | #242 | Tragic 44.5% |
| Immigrants | Ethiopia | 0.7 /100 | #243 | Tragic 44.5% |
| Japanese | 0.6 /100 | #244 | Tragic 44.5% |