Bulgarian vs Salvadoran Disability
COMPARE
Bulgarian
Salvadoran
Disability
Disability Comparison
Bulgarians
Salvadorans
11.0%
DISABILITY
99.6/ 100
METRIC RATING
65th/ 347
METRIC RANK
10.9%
DISABILITY
99.8/ 100
METRIC RATING
57th/ 347
METRIC RANK
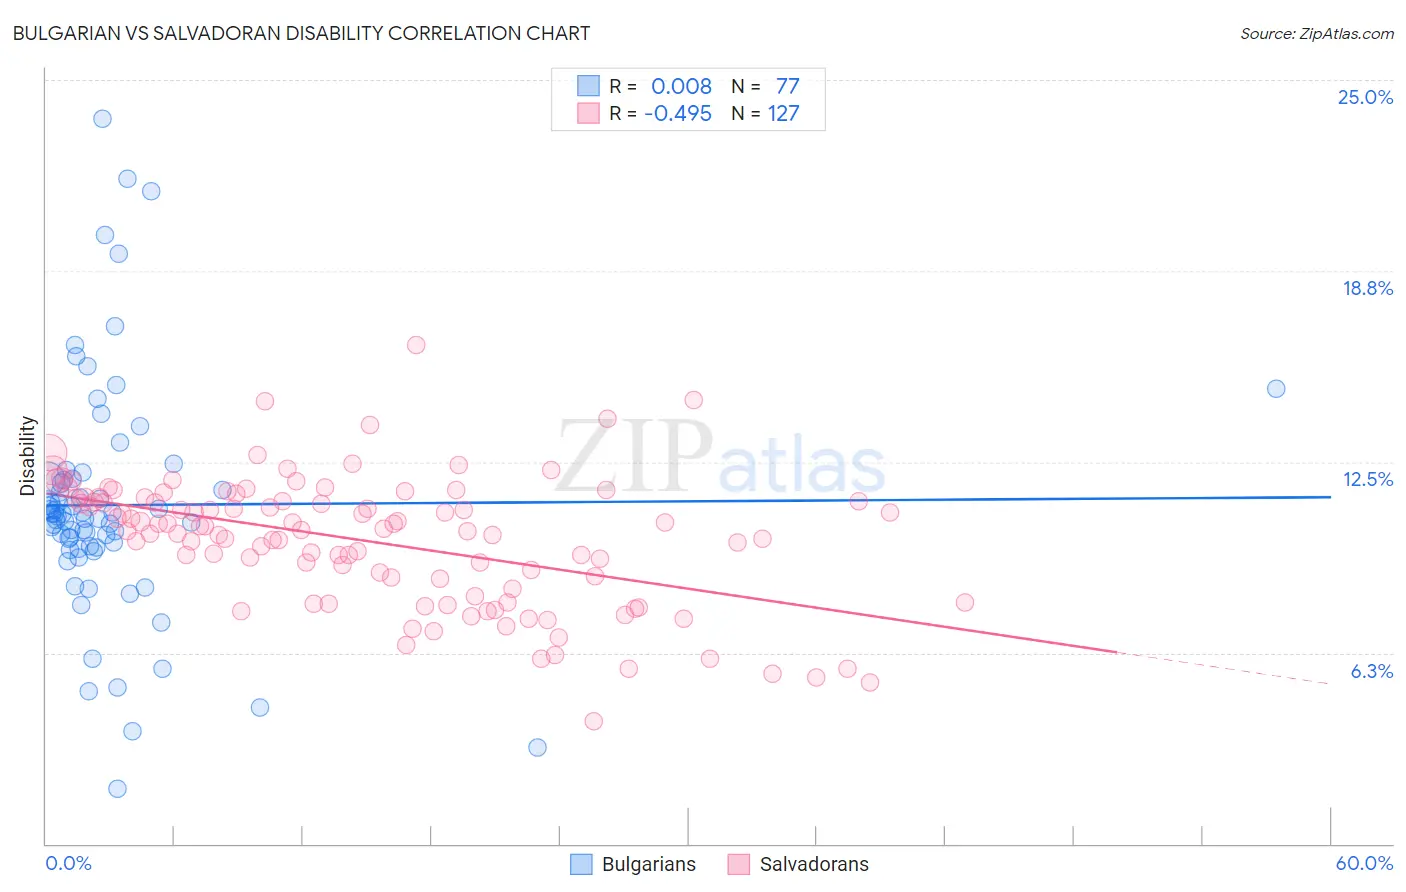
Bulgarian vs Salvadoran Disability Correlation Chart
The statistical analysis conducted on geographies consisting of 205,630,627 people shows no correlation between the proportion of Bulgarians and percentage of population with a disability in the United States with a correlation coefficient (R) of 0.008 and weighted average of 11.0%. Similarly, the statistical analysis conducted on geographies consisting of 398,952,177 people shows a moderate negative correlation between the proportion of Salvadorans and percentage of population with a disability in the United States with a correlation coefficient (R) of -0.495 and weighted average of 10.9%, a difference of 0.53%.
Disability Correlation Summary
| Measurement | Bulgarian | Salvadoran |
| Minimum | 1.8% | 4.0% |
| Maximum | 23.7% | 16.3% |
| Range | 21.9% | 12.3% |
| Mean | 11.1% | 9.9% |
| Median | 10.7% | 10.3% |
| Interquartile 25% (IQ1) | 9.7% | 8.3% |
| Interquartile 75% (IQ3) | 11.9% | 11.3% |
| Interquartile Range (IQR) | 2.3% | 3.0% |
| Standard Deviation (Sample) | 3.9% | 2.1% |
| Standard Deviation (Population) | 3.9% | 2.1% |
Demographics Similar to Bulgarians and Salvadorans by Disability
In terms of disability, the demographic groups most similar to Bulgarians are Laotian (11.0%, a difference of 0.010%), Immigrants from Sweden (11.0%, a difference of 0.020%), Colombian (11.0%, a difference of 0.10%), Immigrants from Eritrea (11.0%, a difference of 0.20%), and Immigrants from Northern Africa (10.9%, a difference of 0.22%). Similarly, the demographic groups most similar to Salvadorans are Immigrants from South America (10.9%, a difference of 0.030%), Immigrants from Colombia (10.9%, a difference of 0.12%), Zimbabwean (10.9%, a difference of 0.22%), Immigrants from Lithuania (10.9%, a difference of 0.24%), and Immigrants from Bulgaria (10.9%, a difference of 0.27%).
| Demographics | Rating | Rank | Disability |
| Peruvians | 99.8 /100 | #51 | Exceptional 10.9% |
| South Americans | 99.8 /100 | #52 | Exceptional 10.9% |
| Immigrants | Spain | 99.8 /100 | #53 | Exceptional 10.9% |
| Jordanians | 99.8 /100 | #54 | Exceptional 10.9% |
| Immigrants | El Salvador | 99.8 /100 | #55 | Exceptional 10.9% |
| Immigrants | Lithuania | 99.8 /100 | #56 | Exceptional 10.9% |
| Salvadorans | 99.8 /100 | #57 | Exceptional 10.9% |
| Immigrants | South America | 99.8 /100 | #58 | Exceptional 10.9% |
| Immigrants | Colombia | 99.7 /100 | #59 | Exceptional 10.9% |
| Zimbabweans | 99.7 /100 | #60 | Exceptional 10.9% |
| Immigrants | Bulgaria | 99.7 /100 | #61 | Exceptional 10.9% |
| Immigrants | Northern Africa | 99.7 /100 | #62 | Exceptional 10.9% |
| Immigrants | Eritrea | 99.7 /100 | #63 | Exceptional 11.0% |
| Immigrants | Sweden | 99.6 /100 | #64 | Exceptional 11.0% |
| Bulgarians | 99.6 /100 | #65 | Exceptional 11.0% |
| Laotians | 99.6 /100 | #66 | Exceptional 11.0% |
| Colombians | 99.6 /100 | #67 | Exceptional 11.0% |
| Immigrants | Afghanistan | 99.6 /100 | #68 | Exceptional 11.0% |
| Sri Lankans | 99.5 /100 | #69 | Exceptional 11.0% |
| Immigrants | France | 99.4 /100 | #70 | Exceptional 11.0% |
| Immigrants | Lebanon | 99.4 /100 | #71 | Exceptional 11.0% |