Bulgarian vs Lithuanian Average Family Size
COMPARE
Bulgarian
Lithuanian
Average Family Size
Average Family Size Comparison
Bulgarians
Lithuanians
3.13
AVERAGE FAMILY SIZE
0.1/ 100
METRIC RATING
313th/ 347
METRIC RANK
3.10
AVERAGE FAMILY SIZE
0.0/ 100
METRIC RATING
334th/ 347
METRIC RANK
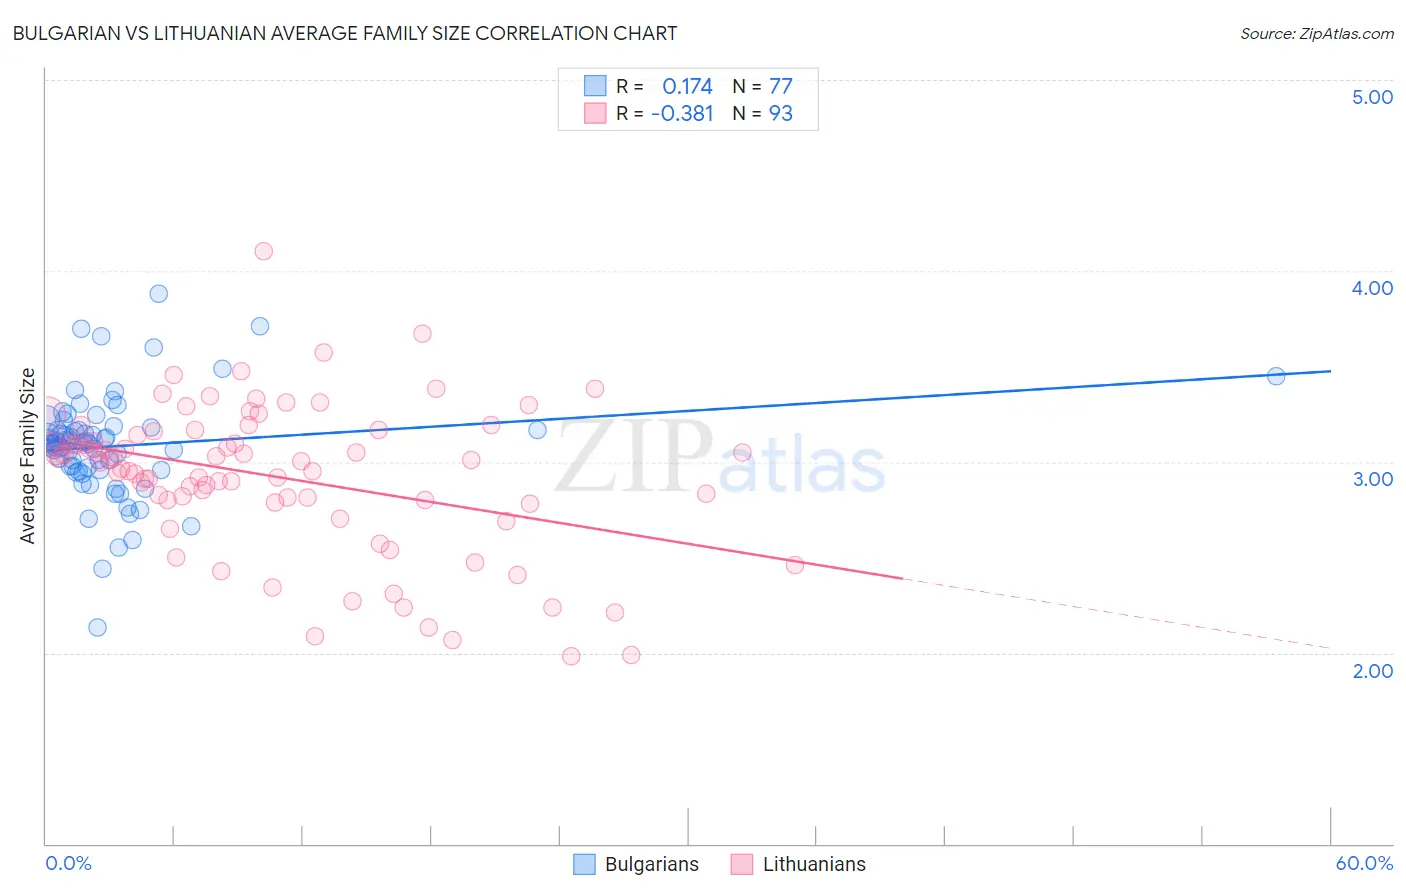
Bulgarian vs Lithuanian Average Family Size Correlation Chart
The statistical analysis conducted on geographies consisting of 205,566,985 people shows a poor positive correlation between the proportion of Bulgarians and average family size in the United States with a correlation coefficient (R) of 0.174 and weighted average of 3.13. Similarly, the statistical analysis conducted on geographies consisting of 421,743,264 people shows a mild negative correlation between the proportion of Lithuanians and average family size in the United States with a correlation coefficient (R) of -0.381 and weighted average of 3.10, a difference of 0.71%.
Average Family Size Correlation Summary
| Measurement | Bulgarian | Lithuanian |
| Minimum | 2.13 | 1.98 |
| Maximum | 3.88 | 4.10 |
| Range | 1.75 | 2.12 |
| Mean | 3.08 | 2.92 |
| Median | 3.09 | 3.00 |
| Interquartile 25% (IQ1) | 2.96 | 2.79 |
| Interquartile 75% (IQ3) | 3.17 | 3.15 |
| Interquartile Range (IQR) | 0.21 | 0.36 |
| Standard Deviation (Sample) | 0.28 | 0.39 |
| Standard Deviation (Population) | 0.27 | 0.38 |
Similar Demographics by Average Family Size
Demographics Similar to Bulgarians by Average Family Size
In terms of average family size, the demographic groups most similar to Bulgarians are Immigrants from Australia (3.13, a difference of 0.0%), Immigrants from Northern Europe (3.13, a difference of 0.030%), Russian (3.12, a difference of 0.040%), Immigrants from Scotland (3.12, a difference of 0.060%), and Czechoslovakian (3.13, a difference of 0.070%).
| Demographics | Rating | Rank | Average Family Size |
| Immigrants | Ireland | 0.1 /100 | #306 | Tragic 3.13 |
| Immigrants | Serbia | 0.1 /100 | #307 | Tragic 3.13 |
| Slavs | 0.1 /100 | #308 | Tragic 3.13 |
| Northern Europeans | 0.1 /100 | #309 | Tragic 3.13 |
| Czechoslovakians | 0.1 /100 | #310 | Tragic 3.13 |
| Immigrants | Northern Europe | 0.1 /100 | #311 | Tragic 3.13 |
| Immigrants | Australia | 0.1 /100 | #312 | Tragic 3.13 |
| Bulgarians | 0.1 /100 | #313 | Tragic 3.13 |
| Russians | 0.1 /100 | #314 | Tragic 3.12 |
| Immigrants | Scotland | 0.1 /100 | #315 | Tragic 3.12 |
| Serbians | 0.1 /100 | #316 | Tragic 3.12 |
| Italians | 0.1 /100 | #317 | Tragic 3.12 |
| Eastern Europeans | 0.1 /100 | #318 | Tragic 3.12 |
| Welsh | 0.1 /100 | #319 | Tragic 3.12 |
| Immigrants | North America | 0.0 /100 | #320 | Tragic 3.12 |
Demographics Similar to Lithuanians by Average Family Size
In terms of average family size, the demographic groups most similar to Lithuanians are Estonian (3.10, a difference of 0.0%), Luxembourger (3.10, a difference of 0.030%), Scotch-Irish (3.11, a difference of 0.050%), Scottish (3.11, a difference of 0.050%), and Latvian (3.11, a difference of 0.060%).
| Demographics | Rating | Rank | Average Family Size |
| Dutch | 0.0 /100 | #327 | Tragic 3.11 |
| Czechs | 0.0 /100 | #328 | Tragic 3.11 |
| Belgians | 0.0 /100 | #329 | Tragic 3.11 |
| Latvians | 0.0 /100 | #330 | Tragic 3.11 |
| Scotch-Irish | 0.0 /100 | #331 | Tragic 3.11 |
| Scottish | 0.0 /100 | #332 | Tragic 3.11 |
| Estonians | 0.0 /100 | #333 | Tragic 3.10 |
| Lithuanians | 0.0 /100 | #334 | Tragic 3.10 |
| Luxembourgers | 0.0 /100 | #335 | Tragic 3.10 |
| Irish | 0.0 /100 | #336 | Tragic 3.10 |
| Swedes | 0.0 /100 | #337 | Tragic 3.10 |
| French | 0.0 /100 | #338 | Tragic 3.10 |
| Croatians | 0.0 /100 | #339 | Tragic 3.10 |
| Finns | 0.0 /100 | #340 | Tragic 3.09 |
| Poles | 0.0 /100 | #341 | Tragic 3.09 |