Eastern European vs Immigrants from France Family Households
COMPARE
Eastern European
Immigrants from France
Family Households
Family Households Comparison
Eastern Europeans
Immigrants from France
63.4%
FAMILY HOUSEHOLDS
1.6/ 100
METRIC RATING
244th/ 347
METRIC RANK
61.3%
FAMILY HOUSEHOLDS
0.0/ 100
METRIC RATING
331st/ 347
METRIC RANK
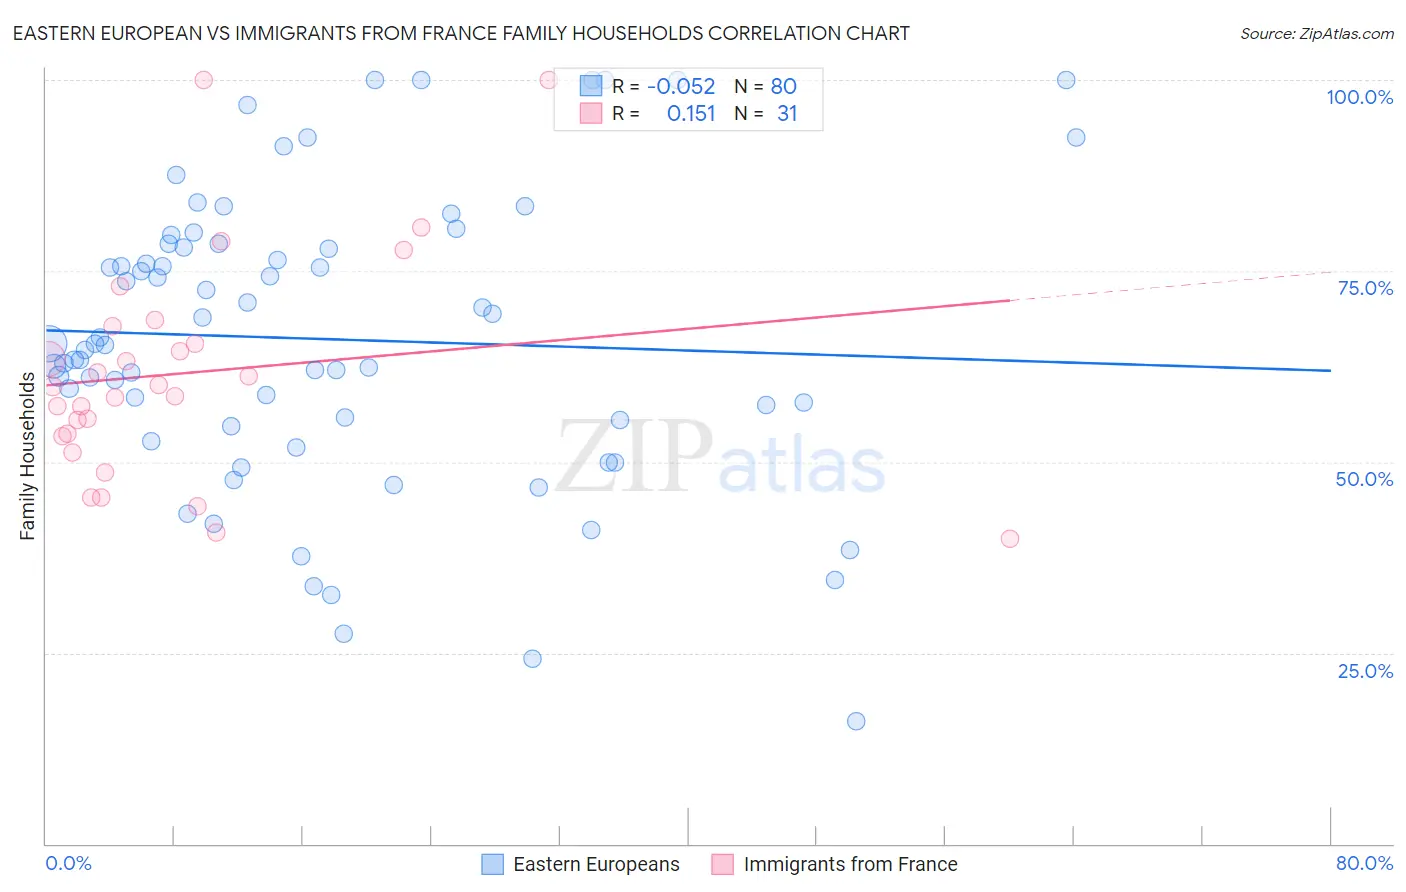
Eastern European vs Immigrants from France Family Households Correlation Chart
The statistical analysis conducted on geographies consisting of 460,961,186 people shows a slight negative correlation between the proportion of Eastern Europeans and percentage of family households in the United States with a correlation coefficient (R) of -0.052 and weighted average of 63.4%. Similarly, the statistical analysis conducted on geographies consisting of 287,855,925 people shows a poor positive correlation between the proportion of Immigrants from France and percentage of family households in the United States with a correlation coefficient (R) of 0.151 and weighted average of 61.3%, a difference of 3.5%.
Family Households Correlation Summary
| Measurement | Eastern European | Immigrants from France |
| Minimum | 16.0% | 40.0% |
| Maximum | 100.0% | 100.0% |
| Range | 84.0% | 60.0% |
| Mean | 66.1% | 61.7% |
| Median | 65.3% | 59.9% |
| Interquartile 25% (IQ1) | 55.1% | 53.3% |
| Interquartile 75% (IQ3) | 78.3% | 67.7% |
| Interquartile Range (IQR) | 23.2% | 14.4% |
| Standard Deviation (Sample) | 19.1% | 14.6% |
| Standard Deviation (Population) | 19.0% | 14.4% |
Similar Demographics by Family Households
Demographics Similar to Eastern Europeans by Family Households
In terms of family households, the demographic groups most similar to Eastern Europeans are Immigrants from Dominica (63.4%, a difference of 0.0%), Immigrants from Ghana (63.4%, a difference of 0.020%), Immigrants from Czechoslovakia (63.4%, a difference of 0.030%), Immigrants from Uzbekistan (63.4%, a difference of 0.030%), and Immigrants from Israel (63.4%, a difference of 0.040%).
| Demographics | Rating | Rank | Family Households |
| Comanche | 2.1 /100 | #237 | Tragic 63.5% |
| Immigrants | Zimbabwe | 2.0 /100 | #238 | Tragic 63.5% |
| Aleuts | 1.9 /100 | #239 | Tragic 63.4% |
| South Africans | 1.9 /100 | #240 | Tragic 63.4% |
| Immigrants | St. Vincent and the Grenadines | 1.9 /100 | #241 | Tragic 63.4% |
| Immigrants | Israel | 1.8 /100 | #242 | Tragic 63.4% |
| Immigrants | Czechoslovakia | 1.8 /100 | #243 | Tragic 63.4% |
| Eastern Europeans | 1.6 /100 | #244 | Tragic 63.4% |
| Immigrants | Dominica | 1.6 /100 | #245 | Tragic 63.4% |
| Immigrants | Ghana | 1.6 /100 | #246 | Tragic 63.4% |
| Immigrants | Uzbekistan | 1.5 /100 | #247 | Tragic 63.4% |
| Dominicans | 1.5 /100 | #248 | Tragic 63.4% |
| Russians | 1.4 /100 | #249 | Tragic 63.4% |
| Immigrants | Japan | 1.4 /100 | #250 | Tragic 63.4% |
| Taiwanese | 1.2 /100 | #251 | Tragic 63.3% |
Demographics Similar to Immigrants from France by Family Households
In terms of family households, the demographic groups most similar to Immigrants from France are Immigrants from Australia (61.3%, a difference of 0.0%), Ethiopian (61.2%, a difference of 0.070%), Cambodian (61.4%, a difference of 0.14%), Kiowa (61.4%, a difference of 0.16%), and Immigrants from Ethiopia (61.2%, a difference of 0.16%).
| Demographics | Rating | Rank | Family Households |
| Immigrants | West Indies | 0.0 /100 | #324 | Tragic 61.6% |
| Immigrants | Switzerland | 0.0 /100 | #325 | Tragic 61.6% |
| Indonesians | 0.0 /100 | #326 | Tragic 61.5% |
| Blacks/African Americans | 0.0 /100 | #327 | Tragic 61.5% |
| Kiowa | 0.0 /100 | #328 | Tragic 61.4% |
| Cambodians | 0.0 /100 | #329 | Tragic 61.4% |
| Immigrants | Australia | 0.0 /100 | #330 | Tragic 61.3% |
| Immigrants | France | 0.0 /100 | #331 | Tragic 61.3% |
| Ethiopians | 0.0 /100 | #332 | Tragic 61.2% |
| Immigrants | Ethiopia | 0.0 /100 | #333 | Tragic 61.2% |
| Immigrants | Eastern Africa | 0.0 /100 | #334 | Tragic 61.1% |
| Carpatho Rusyns | 0.0 /100 | #335 | Tragic 61.1% |
| German Russians | 0.0 /100 | #336 | Tragic 60.9% |
| Soviet Union | 0.0 /100 | #337 | Tragic 60.9% |
| Immigrants | Eritrea | 0.0 /100 | #338 | Tragic 60.8% |