Brazilian vs Zimbabwean Single Mother Households

COMPARE

Brazilian
Race
Ancestry
AfghanAfricanAlaska NativeAlaskan AthabascanAlbanianAleutAlsatianAmericanApacheArabArapahoArgentineanArmenianAssyrian/Chaldean/SyriacAustralianAustrianBahamianBangladeshiBarbadianBasqueBelgianBelizeanBermudanBhutaneseBlackfeetBolivianBrazilianBritishBritish West IndianBulgarianBurmeseCajunCambodianCanadianCape VerdeanCarpatho RusynCelticCentral AmericanCentral American IndianCherokeeCheyenneChickasawChileanChineseChippewaChoctawColombianColvilleComancheCosta RicanCreeCreekCroatianCrowCubanCypriotCzechCzechoslovakianDanishDelawareDominicanDutchDutch West IndianEastern EuropeanEcuadorianEgyptianEnglishEstonianEthiopianEuropeanFijianFilipinoFinnishFrenchFrench American IndianFrench CanadianGermanGerman RussianGhanaianGreekGuamanian/ChamorroGuatemalanGuyaneseHaitianHmongHonduranHopiHoumaHungarianIcelanderIndian (Asian)IndonesianInupiatIranianIraqiIrishIroquoisIsraeliItalianJamaicanJapaneseJordanianKenyanKiowaKoreanLaotianLatvianLebaneseLiberianLithuanianLumbeeLuxembourgerMacedonianMalaysianMalteseMarshalleseMenomineeMexicanMexican American IndianMongolianMoroccanNative HawaiianNavajoNepaleseNew ZealanderNicaraguanNigerianNorthern EuropeanNorwegianOkinawanOsageOttawaPaiutePakistaniPalestinianPanamanianParaguayanPennsylvania GermanPeruvianPimaPolishPortuguesePotawatomiPuebloPuerto RicanPuget Sound SalishRomanianRussianSalvadoranSamoanScandinavianScotch-IrishScottishSeminoleSenegaleseSerbianShoshoneSierra LeoneanSiouxSlavicSlovakSloveneSomaliSouth AfricanSouth AmericanSouth American IndianSoviet UnionSpaniardSpanishSpanish AmericanSpanish American IndianSri LankanSubsaharan AfricanSudaneseSwedishSwissSyrianTaiwaneseThaiTlingit-HaidaTohono O'OdhamTonganTrinidadian and TobagonianTsimshianTurkishU.S. Virgin IslanderUgandanUkrainianUruguayanUteVenezuelanVietnameseWelshWest IndianYakamaYaquiYugoslavianYumanYup'ik
Immigration
NonimmigrantsImmigrantsAfghanistanAfricaAlbaniaArgentinaArmeniaAsiaAustraliaAustriaBahamasBangladeshBarbadosBelarusBelgiumBelizeBoliviaBosnia and HerzegovinaBrazilBulgariaBurma/MyanmarCabo VerdeCambodiaCameroonCanadaCaribbeanCentral AmericaChileChinaColombiaCongoCosta RicaCroatiaCubaCzechoslovakiaDenmarkDominicaDominican RepublicEastern AfricaEastern AsiaEastern EuropeEcuadorEgyptEl SalvadorEnglandEritreaEthiopiaEuropeFijiFranceGermanyGhanaGreeceGrenadaGuatemalaGuyanaHaitiHondurasHong KongHungaryIndiaIndonesiaIranIraqIrelandIsraelItalyJamaicaJapanJordanKazakhstanKenyaKoreaKuwaitLaosLatin AmericaLatviaLebanonLiberiaLithuaniaMalaysiaMexicoMicronesiaMiddle AfricaMoldovaMoroccoNepalNetherlandsNicaraguaNigeriaNorth AmericaNorth MacedoniaNorthern AfricaNorthern EuropeNorwayOceaniaPakistanPanamaPeruPhilippinesPolandPortugalRomaniaRussiaSaudi ArabiaScotlandSenegalSerbiaSierra LeoneSingaporeSomaliaSouth AfricaSouth AmericaSouth Central AsiaSouth Eastern AsiaSouthern EuropeSpainSri LankaSt. Vincent and the GrenadinesSudanSwedenSwitzerlandSyriaTaiwanThailandTrinidad and TobagoTurkeyUgandaUkraineUruguayUzbekistanVenezuelaVietnamWest IndiesWestern AfricaWestern AsiaWestern EuropeYemenZaireZimbabweAzores
Zimbabwean
Race
Ancestry
AfghanAfricanAlaska NativeAlaskan AthabascanAlbanianAleutAlsatianAmericanApacheArabArapahoArgentineanArmenianAssyrian/Chaldean/SyriacAustralianAustrianBahamianBangladeshiBarbadianBasqueBelgianBelizeanBermudanBhutaneseBlackfeetBolivianBritishBritish West IndianBulgarianBurmeseCajunCambodianCanadianCape VerdeanCarpatho RusynCelticCentral AmericanCentral American IndianCherokeeCheyenneChickasawChileanChineseChippewaChoctawColombianColvilleComancheCosta RicanCreeCreekCroatianCrowCubanCypriotCzechCzechoslovakianDanishDelawareDominicanDutchDutch West IndianEastern EuropeanEcuadorianEgyptianEnglishEstonianEthiopianEuropeanFijianFilipinoFinnishFrenchFrench American IndianFrench CanadianGermanGerman RussianGhanaianGreekGuamanian/ChamorroGuatemalanGuyaneseHaitianHmongHonduranHopiHoumaHungarianIcelanderIndian (Asian)IndonesianInupiatIranianIraqiIrishIroquoisIsraeliItalianJamaicanJapaneseJordanianKenyanKiowaKoreanLaotianLatvianLebaneseLiberianLithuanianLumbeeLuxembourgerMacedonianMalaysianMalteseMarshalleseMenomineeMexicanMexican American IndianMongolianMoroccanNative HawaiianNavajoNepaleseNew ZealanderNicaraguanNigerianNorthern EuropeanNorwegianOkinawanOsageOttawaPaiutePakistaniPalestinianPanamanianParaguayanPennsylvania GermanPeruvianPimaPolishPortuguesePotawatomiPuebloPuerto RicanPuget Sound SalishRomanianRussianSalvadoranSamoanScandinavianScotch-IrishScottishSeminoleSenegaleseSerbianShoshoneSierra LeoneanSiouxSlavicSlovakSloveneSomaliSouth AfricanSouth AmericanSouth American IndianSoviet UnionSpaniardSpanishSpanish AmericanSpanish American IndianSri LankanSubsaharan AfricanSudaneseSwedishSwissSyrianTaiwaneseThaiTlingit-HaidaTohono O'OdhamTonganTrinidadian and TobagonianTsimshianTurkishU.S. Virgin IslanderUgandanUkrainianUruguayanUteVenezuelanVietnameseWelshWest IndianYakamaYaquiYugoslavianYumanYup'ikZimbabwean
Immigration
NonimmigrantsImmigrantsAfghanistanAfricaAlbaniaArgentinaArmeniaAsiaAustraliaAustriaBahamasBangladeshBarbadosBelarusBelgiumBelizeBoliviaBosnia and HerzegovinaBrazilBulgariaBurma/MyanmarCabo VerdeCambodiaCameroonCanadaCaribbeanCentral AmericaChileChinaColombiaCongoCosta RicaCroatiaCubaCzechoslovakiaDenmarkDominicaDominican RepublicEastern AfricaEastern AsiaEastern EuropeEcuadorEgyptEl SalvadorEnglandEritreaEthiopiaEuropeFijiFranceGermanyGhanaGreeceGrenadaGuatemalaGuyanaHaitiHondurasHong KongHungaryIndiaIndonesiaIranIraqIrelandIsraelItalyJamaicaJapanJordanKazakhstanKenyaKoreaKuwaitLaosLatin AmericaLatviaLebanonLiberiaLithuaniaMalaysiaMexicoMicronesiaMiddle AfricaMoldovaMoroccoNepalNetherlandsNicaraguaNigeriaNorth AmericaNorth MacedoniaNorthern AfricaNorthern EuropeNorwayOceaniaPakistanPanamaPeruPhilippinesPolandPortugalRomaniaRussiaSaudi ArabiaScotlandSenegalSerbiaSierra LeoneSingaporeSomaliaSouth AfricaSouth AmericaSouth Central AsiaSouth Eastern AsiaSouthern EuropeSpainSri LankaSt. Vincent and the GrenadinesSudanSwedenSwitzerlandSyriaTaiwanThailandTrinidad and TobagoTurkeyUgandaUkraineUruguayUzbekistanVenezuelaVietnamWest IndiesWestern AfricaWestern AsiaWestern EuropeYemenZaireZimbabweAzores
Single Mother Households
Income
Poverty
Unemployment
Labor Participation
Family Structure
Vehicle Availability
Education Level
Disability

Single Mother Households Comparison

Brazilians

Zimbabweans

Average
Excellent
6.2%
SINGLE MOTHER HOUSEHOLDS
59.1/ 100
METRIC RATING
167th/ 347
METRIC RANK
6.1%
SINGLE MOTHER HOUSEHOLDS
80.7/ 100
METRIC RATING
150th/ 347
METRIC RANK

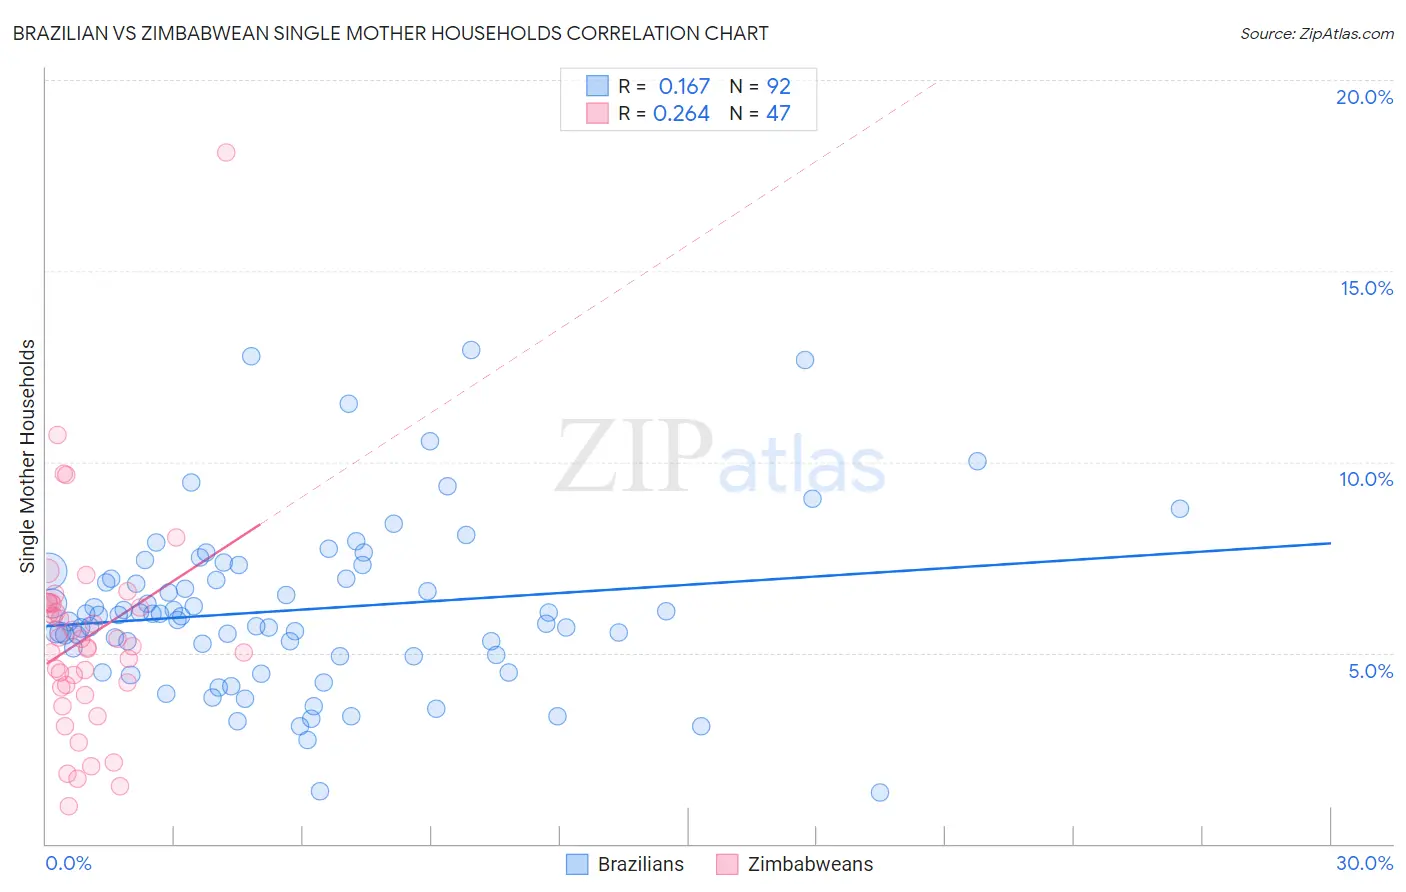
Brazilian vs Zimbabwean Single Mother Households Correlation Chart

The statistical analysis conducted on geographies consisting of 323,280,252 people shows a poor positive correlation between the proportion of Brazilians and percentage of single mother households in the United States with a correlation coefficient (R) of 0.167 and weighted average of 6.2%. Similarly, the statistical analysis conducted on geographies consisting of 69,178,792 people shows a weak positive correlation between the proportion of Zimbabweans and percentage of single mother households in the United States with a correlation coefficient (R) of 0.264 and weighted average of 6.1%, a difference of 3.0%.
Brazilian vs Zimbabwean Single Mother Households

Single Mother Households Correlation Summary

MeasurementBrazilianZimbabwean
Minimum1.3%0.99%
Maximum12.9%18.1%
Range11.6%17.1%
Mean6.1%5.4%
Median6.0%5.2%
Interquartile 25% (IQ1)4.9%4.1%
Interquartile 75% (IQ3)7.0%6.3%
Interquartile Range (IQR)2.1%2.2%
Standard Deviation (Sample)2.2%2.8%
Standard Deviation (Population)2.2%2.8%

Demographics Similar to Brazilians and Zimbabweans by Single Mother Households

In terms of single mother households, the demographic groups most similar to Brazilians are Immigrants from Chile (6.3%, a difference of 0.090%), Sri Lankan (6.2%, a difference of 0.57%), Immigrants from Syria (6.2%, a difference of 1.0%), Immigrants from Northern Africa (6.2%, a difference of 1.1%), and Alsatian (6.2%, a difference of 1.2%). Similarly, the demographic groups most similar to Zimbabweans are Immigrants from Southern Europe (6.1%, a difference of 0.050%), Immigrants from Albania (6.1%, a difference of 0.14%), Scotch-Irish (6.0%, a difference of 0.24%), Pakistani (6.1%, a difference of 0.28%), and Immigrants from Brazil (6.1%, a difference of 0.32%).
DemographicsRating | RankSingle Mother Households
Scotch-Irish
82.0
/100
|
#148
Excellent
6.0%
Immigrants | Albania
81.5
/100
|
#149
Excellent
6.1%
Zimbabweans
80.7
/100
|
#150
Excellent
6.1%
Immigrants | Southern Europe
80.5
/100
|
#151
Excellent
6.1%
Pakistanis
79.2
/100
|
#152
Good
6.1%
Immigrants | Brazil
78.9
/100
|
#153
Good
6.1%
Immigrants | Philippines
78.5
/100
|
#154
Good
6.1%
Whites/Caucasians
76.5
/100
|
#155
Good
6.1%
Native Hawaiians
75.0
/100
|
#156
Good
6.1%
Chileans
74.2
/100
|
#157
Good
6.1%
Celtics
73.3
/100
|
#158
Good
6.1%
Yugoslavians
73.1
/100
|
#159
Good
6.1%
Iraqis
73.0
/100
|
#160
Good
6.1%
Immigrants | Germany
72.4
/100
|
#161
Good
6.1%
Immigrants | Zimbabwe
69.9
/100
|
#162
Good
6.2%
Alsatians
68.7
/100
|
#163
Good
6.2%
Immigrants | Northern Africa
68.0
/100
|
#164
Good
6.2%
Immigrants | Syria
67.4
/100
|
#165
Good
6.2%
Sri Lankans
63.9
/100
|
#166
Good
6.2%
Brazilians
59.1
/100
|
#167
Average
6.2%
Immigrants | Chile
58.3
/100
|
#168
Average
6.3%