Bolivian vs Marshallese 5th Grade
COMPARE
Bolivian
Marshallese
5th Grade
5th Grade Comparison
Bolivians
Marshallese
96.9%
5TH GRADE
0.9/ 100
METRIC RATING
251st/ 347
METRIC RANK
97.4%
5TH GRADE
61.2/ 100
METRIC RATING
160th/ 347
METRIC RANK
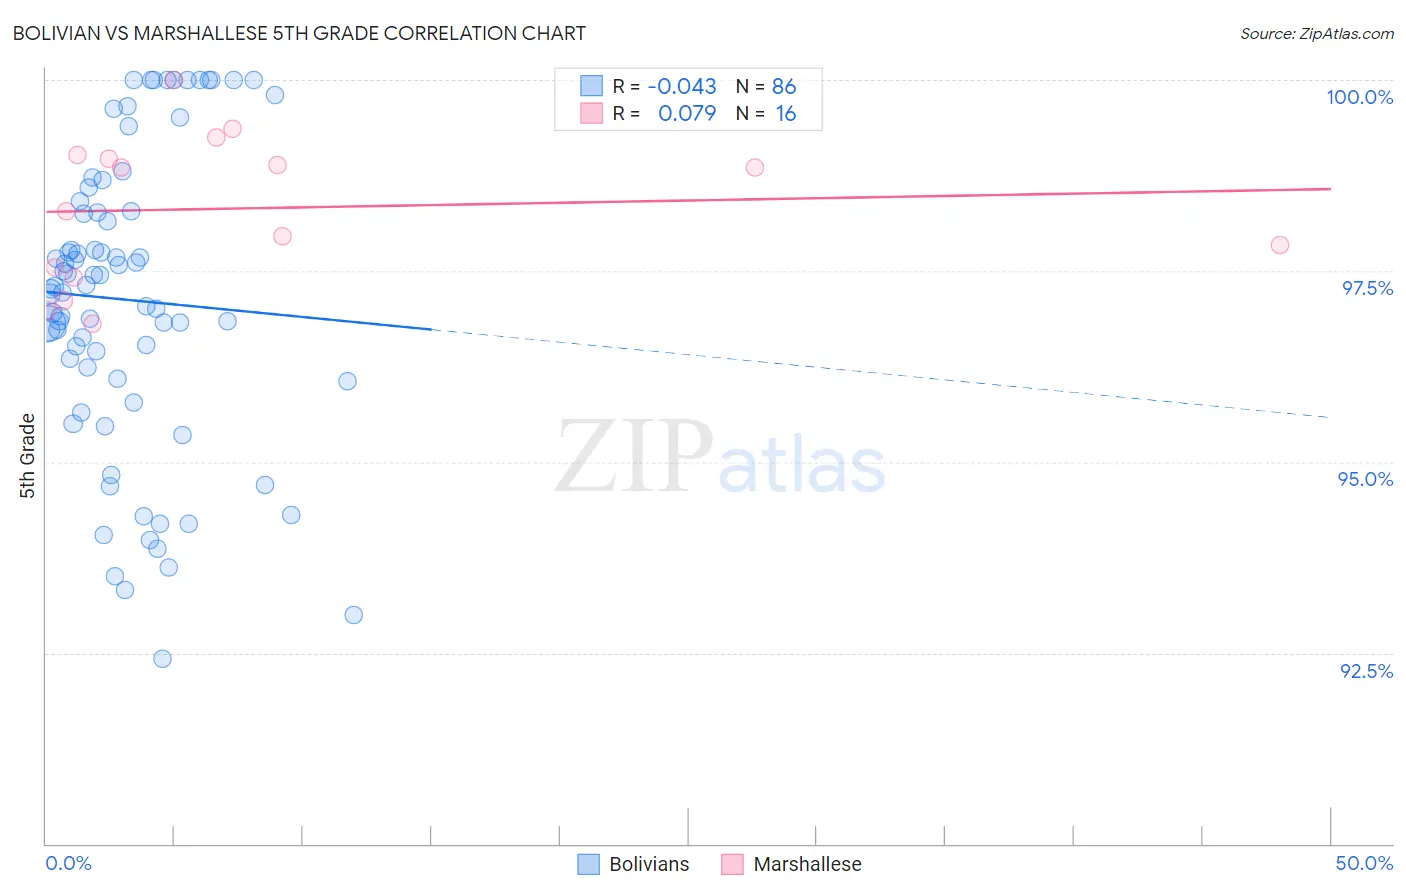
Bolivian vs Marshallese 5th Grade Correlation Chart
The statistical analysis conducted on geographies consisting of 184,663,510 people shows no correlation between the proportion of Bolivians and percentage of population with at least 5th grade education in the United States with a correlation coefficient (R) of -0.043 and weighted average of 96.9%. Similarly, the statistical analysis conducted on geographies consisting of 14,761,315 people shows a slight positive correlation between the proportion of Marshallese and percentage of population with at least 5th grade education in the United States with a correlation coefficient (R) of 0.079 and weighted average of 97.4%, a difference of 0.53%.
5th Grade Correlation Summary
| Measurement | Bolivian | Marshallese |
| Minimum | 92.4% | 96.8% |
| Maximum | 100.0% | 100.0% |
| Range | 7.6% | 3.2% |
| Mean | 97.1% | 98.3% |
| Median | 97.3% | 98.6% |
| Interquartile 25% (IQ1) | 96.1% | 97.5% |
| Interquartile 75% (IQ3) | 98.3% | 99.0% |
| Interquartile Range (IQR) | 2.2% | 1.5% |
| Standard Deviation (Sample) | 1.9% | 0.96% |
| Standard Deviation (Population) | 1.9% | 0.93% |
Similar Demographics by 5th Grade
Demographics Similar to Bolivians by 5th Grade
In terms of 5th grade, the demographic groups most similar to Bolivians are Immigrants from Uruguay (96.9%, a difference of 0.0%), Immigrants from Liberia (96.9%, a difference of 0.0%), Jamaican (96.9%, a difference of 0.0%), Immigrants from Africa (96.9%, a difference of 0.010%), and U.S. Virgin Islander (96.9%, a difference of 0.010%).
| Demographics | Rating | Rank | 5th Grade |
| Koreans | 1.6 /100 | #244 | Tragic 96.9% |
| Colombians | 1.3 /100 | #245 | Tragic 96.9% |
| Ethiopians | 1.2 /100 | #246 | Tragic 96.9% |
| Immigrants | Africa | 1.1 /100 | #247 | Tragic 96.9% |
| U.S. Virgin Islanders | 1.1 /100 | #248 | Tragic 96.9% |
| Immigrants | Uruguay | 1.0 /100 | #249 | Tragic 96.9% |
| Immigrants | Liberia | 1.0 /100 | #250 | Tragic 96.9% |
| Bolivians | 0.9 /100 | #251 | Tragic 96.9% |
| Jamaicans | 0.9 /100 | #252 | Tragic 96.9% |
| Immigrants | Middle Africa | 0.8 /100 | #253 | Tragic 96.8% |
| Immigrants | Senegal | 0.8 /100 | #254 | Tragic 96.8% |
| South Americans | 0.7 /100 | #255 | Tragic 96.8% |
| Immigrants | Congo | 0.7 /100 | #256 | Tragic 96.8% |
| Peruvians | 0.6 /100 | #257 | Tragic 96.8% |
| Immigrants | Ethiopia | 0.5 /100 | #258 | Tragic 96.8% |
Demographics Similar to Marshallese by 5th Grade
In terms of 5th grade, the demographic groups most similar to Marshallese are Kenyan (97.4%, a difference of 0.010%), Immigrants from Iran (97.4%, a difference of 0.010%), Ugandan (97.4%, a difference of 0.010%), Bermudan (97.4%, a difference of 0.010%), and Immigrants from Poland (97.4%, a difference of 0.010%).
| Demographics | Rating | Rank | 5th Grade |
| Alsatians | 74.3 /100 | #153 | Good 97.4% |
| Immigrants | Russia | 71.2 /100 | #154 | Good 97.4% |
| Immigrants | Bosnia and Herzegovina | 71.0 /100 | #155 | Good 97.4% |
| French American Indians | 70.5 /100 | #156 | Good 97.4% |
| Immigrants | Jordan | 70.4 /100 | #157 | Good 97.4% |
| Albanians | 68.3 /100 | #158 | Good 97.4% |
| Immigrants | Italy | 65.2 /100 | #159 | Good 97.4% |
| Marshallese | 61.2 /100 | #160 | Good 97.4% |
| Kenyans | 59.7 /100 | #161 | Average 97.4% |
| Immigrants | Iran | 59.5 /100 | #162 | Average 97.4% |
| Ugandans | 58.9 /100 | #163 | Average 97.4% |
| Bermudans | 58.8 /100 | #164 | Average 97.4% |
| Immigrants | Poland | 57.9 /100 | #165 | Average 97.4% |
| Apache | 57.2 /100 | #166 | Average 97.4% |
| Immigrants | Belarus | 54.6 /100 | #167 | Average 97.3% |