Immigrants from Liberia vs Bolivian Divorced or Separated
COMPARE
Immigrants from Liberia
Bolivian
Divorced or Separated
Divorced or Separated Comparison
Immigrants from Liberia
Bolivians
12.6%
DIVORCED OR SEPARATED
0.4/ 100
METRIC RATING
269th/ 347
METRIC RANK
11.2%
DIVORCED OR SEPARATED
100.0/ 100
METRIC RATING
50th/ 347
METRIC RANK
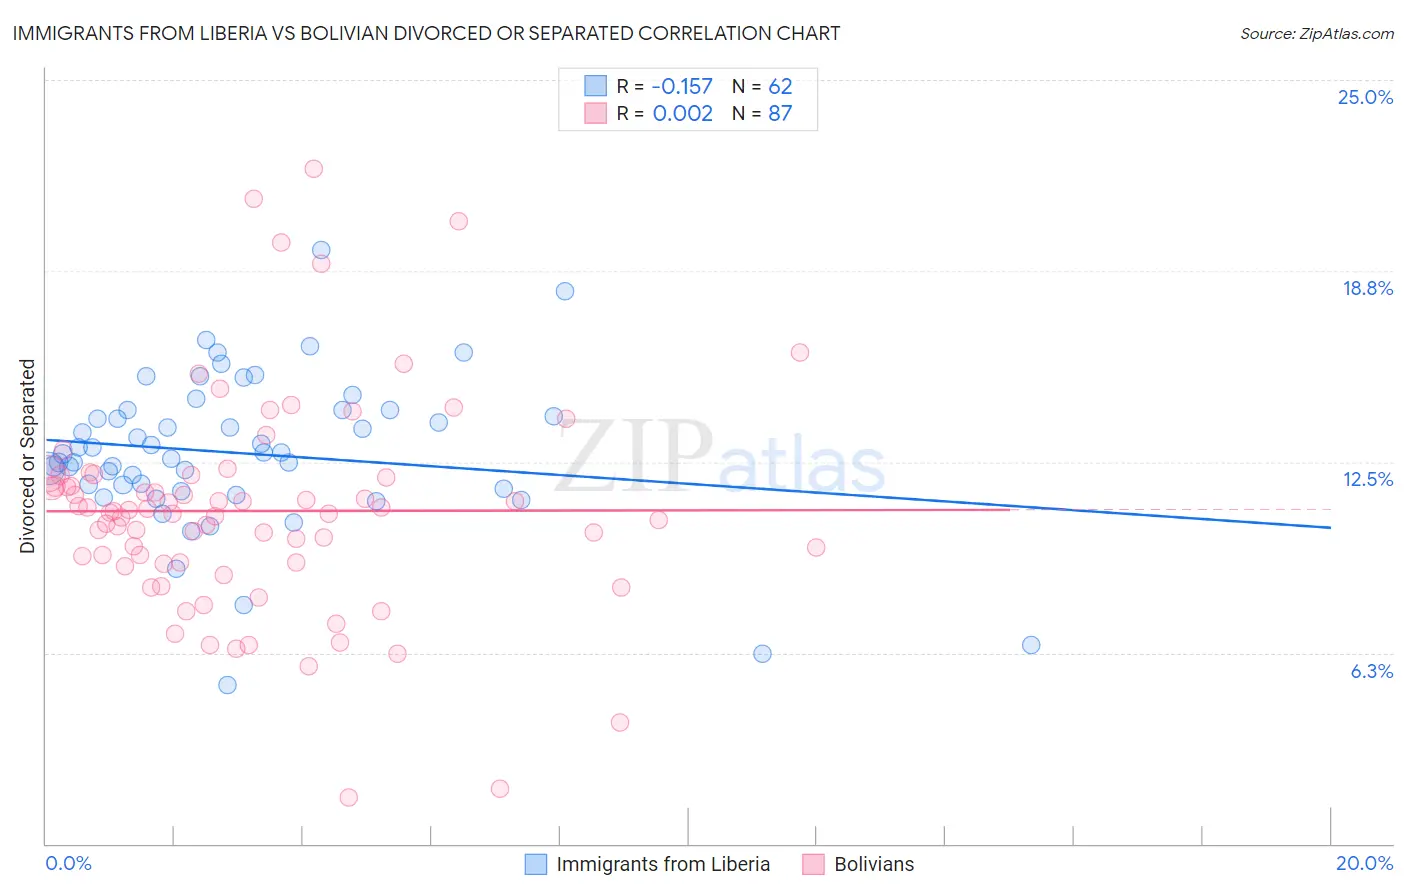
Immigrants from Liberia vs Bolivian Divorced or Separated Correlation Chart
The statistical analysis conducted on geographies consisting of 135,277,258 people shows a poor negative correlation between the proportion of Immigrants from Liberia and percentage of population currently divorced or separated in the United States with a correlation coefficient (R) of -0.157 and weighted average of 12.6%. Similarly, the statistical analysis conducted on geographies consisting of 184,650,431 people shows no correlation between the proportion of Bolivians and percentage of population currently divorced or separated in the United States with a correlation coefficient (R) of 0.002 and weighted average of 11.2%, a difference of 12.6%.
Divorced or Separated Correlation Summary
| Measurement | Immigrants from Liberia | Bolivian |
| Minimum | 5.2% | 1.5% |
| Maximum | 19.4% | 22.1% |
| Range | 14.2% | 20.6% |
| Mean | 12.8% | 10.9% |
| Median | 12.8% | 10.8% |
| Interquartile 25% (IQ1) | 11.6% | 9.2% |
| Interquartile 75% (IQ3) | 14.2% | 12.1% |
| Interquartile Range (IQR) | 2.6% | 2.9% |
| Standard Deviation (Sample) | 2.5% | 3.6% |
| Standard Deviation (Population) | 2.5% | 3.5% |
Similar Demographics by Divorced or Separated
Demographics Similar to Immigrants from Liberia by Divorced or Separated
In terms of divorced or separated, the demographic groups most similar to Immigrants from Liberia are Fijian (12.6%, a difference of 0.010%), Scottish (12.6%, a difference of 0.030%), White/Caucasian (12.6%, a difference of 0.070%), Immigrants from Senegal (12.6%, a difference of 0.080%), and English (12.6%, a difference of 0.090%).
| Demographics | Rating | Rank | Divorced or Separated |
| Basques | 0.5 /100 | #262 | Tragic 12.6% |
| Immigrants | Panama | 0.5 /100 | #263 | Tragic 12.6% |
| English | 0.5 /100 | #264 | Tragic 12.6% |
| Immigrants | Senegal | 0.5 /100 | #265 | Tragic 12.6% |
| Whites/Caucasians | 0.5 /100 | #266 | Tragic 12.6% |
| Scottish | 0.4 /100 | #267 | Tragic 12.6% |
| Fijians | 0.4 /100 | #268 | Tragic 12.6% |
| Immigrants | Liberia | 0.4 /100 | #269 | Tragic 12.6% |
| Ute | 0.4 /100 | #270 | Tragic 12.6% |
| Panamanians | 0.3 /100 | #271 | Tragic 12.7% |
| Immigrants | Middle Africa | 0.3 /100 | #272 | Tragic 12.7% |
| Immigrants | Micronesia | 0.3 /100 | #273 | Tragic 12.7% |
| Bermudans | 0.3 /100 | #274 | Tragic 12.7% |
| Central American Indians | 0.3 /100 | #275 | Tragic 12.7% |
| Spaniards | 0.2 /100 | #276 | Tragic 12.7% |
Demographics Similar to Bolivians by Divorced or Separated
In terms of divorced or separated, the demographic groups most similar to Bolivians are Immigrants from Saudi Arabia (11.2%, a difference of 0.070%), Immigrants from Turkey (11.2%, a difference of 0.080%), Immigrants from Poland (11.2%, a difference of 0.10%), Laotian (11.2%, a difference of 0.12%), and Turkish (11.2%, a difference of 0.23%).
| Demographics | Rating | Rank | Divorced or Separated |
| Immigrants | Belarus | 100.0 /100 | #43 | Exceptional 11.2% |
| Immigrants | Western Asia | 100.0 /100 | #44 | Exceptional 11.2% |
| Turks | 100.0 /100 | #45 | Exceptional 11.2% |
| Laotians | 100.0 /100 | #46 | Exceptional 11.2% |
| Immigrants | Poland | 100.0 /100 | #47 | Exceptional 11.2% |
| Immigrants | Turkey | 100.0 /100 | #48 | Exceptional 11.2% |
| Immigrants | Saudi Arabia | 100.0 /100 | #49 | Exceptional 11.2% |
| Bolivians | 100.0 /100 | #50 | Exceptional 11.2% |
| Immigrants | Bolivia | 100.0 /100 | #51 | Exceptional 11.3% |
| Immigrants | Australia | 99.9 /100 | #52 | Exceptional 11.3% |
| Immigrants | Lithuania | 99.9 /100 | #53 | Exceptional 11.3% |
| Eastern Europeans | 99.9 /100 | #54 | Exceptional 11.3% |
| Immigrants | Yemen | 99.9 /100 | #55 | Exceptional 11.3% |
| Immigrants | Philippines | 99.9 /100 | #56 | Exceptional 11.3% |
| Immigrants | Vietnam | 99.9 /100 | #57 | Exceptional 11.3% |