Belizean vs Navajo Average Family Size
COMPARE
Belizean
Navajo
Average Family Size
Average Family Size Comparison
Belizeans
Navajo
3.39
AVERAGE FAMILY SIZE
100.0/ 100
METRIC RATING
40th/ 347
METRIC RANK
3.65
AVERAGE FAMILY SIZE
100.0/ 100
METRIC RATING
5th/ 347
METRIC RANK
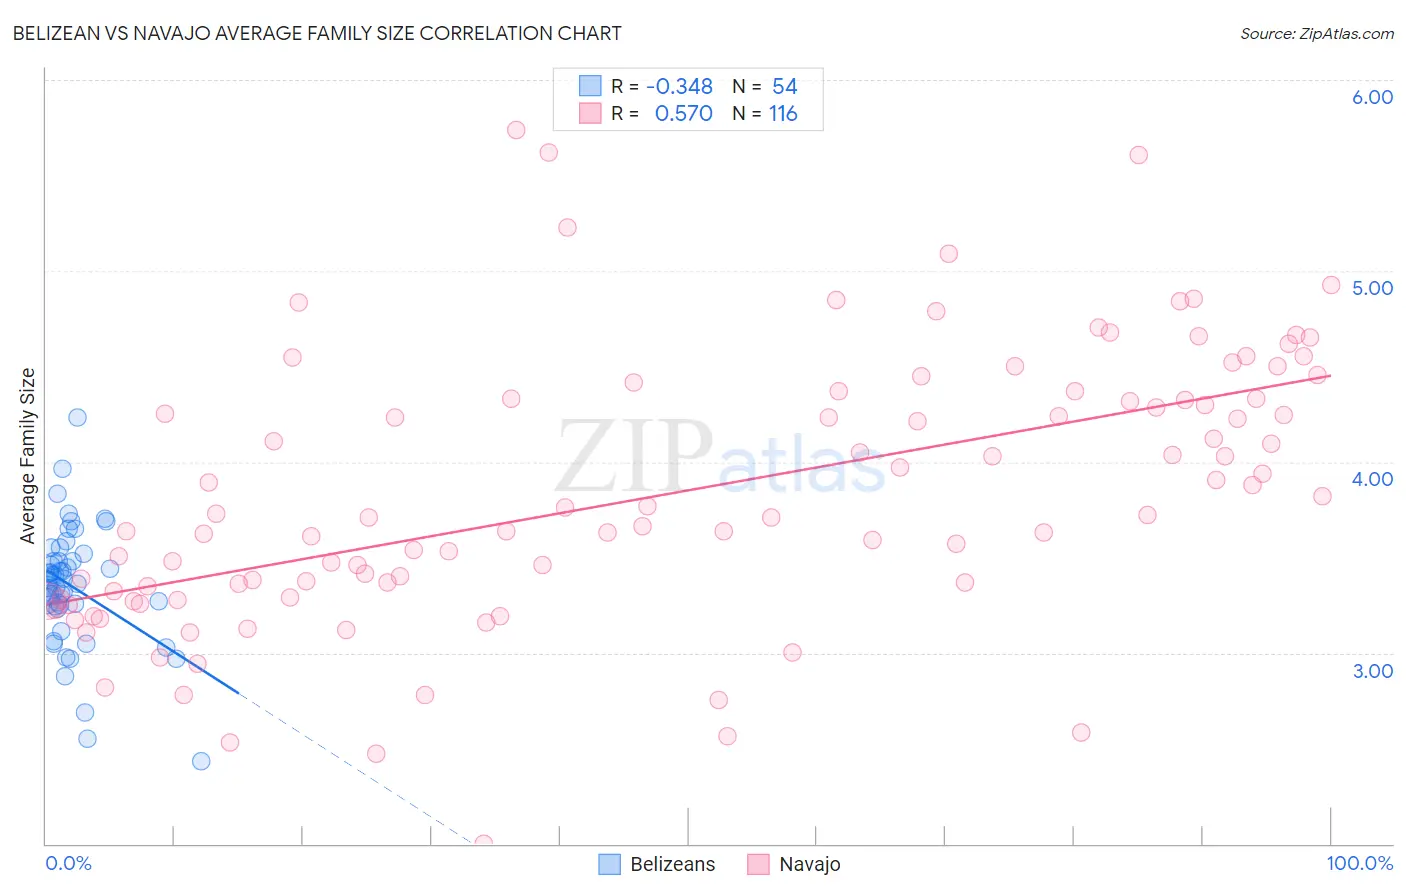
Belizean vs Navajo Average Family Size Correlation Chart
The statistical analysis conducted on geographies consisting of 144,152,249 people shows a mild negative correlation between the proportion of Belizeans and average family size in the United States with a correlation coefficient (R) of -0.348 and weighted average of 3.39. Similarly, the statistical analysis conducted on geographies consisting of 224,751,330 people shows a substantial positive correlation between the proportion of Navajo and average family size in the United States with a correlation coefficient (R) of 0.570 and weighted average of 3.65, a difference of 7.6%.
Average Family Size Correlation Summary
| Measurement | Belizean | Navajo |
| Minimum | 2.43 | 2.00 |
| Maximum | 4.23 | 5.74 |
| Range | 1.80 | 3.74 |
| Mean | 3.34 | 3.83 |
| Median | 3.37 | 3.71 |
| Interquartile 25% (IQ1) | 3.24 | 3.31 |
| Interquartile 75% (IQ3) | 3.48 | 4.33 |
| Interquartile Range (IQR) | 0.24 | 1.03 |
| Standard Deviation (Sample) | 0.32 | 0.71 |
| Standard Deviation (Population) | 0.32 | 0.71 |
Similar Demographics by Average Family Size
Demographics Similar to Belizeans by Average Family Size
In terms of average family size, the demographic groups most similar to Belizeans are Immigrants from Haiti (3.39, a difference of 0.12%), Marshallese (3.38, a difference of 0.17%), Immigrants from Belize (3.39, a difference of 0.20%), Immigrants from Vietnam (3.38, a difference of 0.23%), and Immigrants from Philippines (3.37, a difference of 0.33%).
| Demographics | Rating | Rank | Average Family Size |
| Hawaiians | 100.0 /100 | #33 | Exceptional 3.41 |
| Hispanics or Latinos | 100.0 /100 | #34 | Exceptional 3.41 |
| Guatemalans | 100.0 /100 | #35 | Exceptional 3.40 |
| Immigrants | Guyana | 100.0 /100 | #36 | Exceptional 3.40 |
| Guyanese | 100.0 /100 | #37 | Exceptional 3.40 |
| Immigrants | Belize | 100.0 /100 | #38 | Exceptional 3.39 |
| Immigrants | Haiti | 100.0 /100 | #39 | Exceptional 3.39 |
| Belizeans | 100.0 /100 | #40 | Exceptional 3.39 |
| Marshallese | 100.0 /100 | #41 | Exceptional 3.38 |
| Immigrants | Vietnam | 100.0 /100 | #42 | Exceptional 3.38 |
| Immigrants | Philippines | 100.0 /100 | #43 | Exceptional 3.37 |
| Alaska Natives | 100.0 /100 | #44 | Exceptional 3.37 |
| Shoshone | 100.0 /100 | #45 | Exceptional 3.37 |
| Haitians | 100.0 /100 | #46 | Exceptional 3.37 |
| Vietnamese | 100.0 /100 | #47 | Exceptional 3.37 |
Demographics Similar to Navajo by Average Family Size
In terms of average family size, the demographic groups most similar to Navajo are Arapaho (3.64, a difference of 0.27%), Inupiat (3.63, a difference of 0.48%), Immigrants from Yemen (3.60, a difference of 1.3%), Hopi (3.60, a difference of 1.4%), and Spanish American Indian (3.58, a difference of 1.7%).
| Demographics | Rating | Rank | Average Family Size |
| Yup'ik | 100 /100 | #1 | Exceptional 4.00 |
| Crow | 100 /100 | #2 | Exceptional 3.82 |
| Pueblo | 100 /100 | #3 | Exceptional 3.79 |
| Pima | 100 /100 | #4 | Exceptional 3.75 |
| Navajo | 100.0 /100 | #5 | Exceptional 3.65 |
| Arapaho | 100.0 /100 | #6 | Exceptional 3.64 |
| Inupiat | 100.0 /100 | #7 | Exceptional 3.63 |
| Immigrants | Yemen | 100.0 /100 | #8 | Exceptional 3.60 |
| Hopi | 100.0 /100 | #9 | Exceptional 3.60 |
| Spanish American Indians | 100.0 /100 | #10 | Exceptional 3.58 |
| Tohono O'odham | 100.0 /100 | #11 | Exceptional 3.53 |
| Immigrants | Mexico | 100.0 /100 | #12 | Exceptional 3.52 |
| Sioux | 100.0 /100 | #13 | Exceptional 3.52 |
| Immigrants | Central America | 100.0 /100 | #14 | Exceptional 3.49 |
| Tongans | 100.0 /100 | #15 | Exceptional 3.49 |