Barbadian vs Immigrants from Mexico Single Mother Households
COMPARE
Barbadian
Immigrants from Mexico
Single Mother Households
Single Mother Households Comparison
Barbadians
Immigrants from Mexico
7.9%
SINGLE MOTHER HOUSEHOLDS
0.0/ 100
METRIC RATING
295th/ 347
METRIC RANK
8.2%
SINGLE MOTHER HOUSEHOLDS
0.0/ 100
METRIC RATING
314th/ 347
METRIC RANK
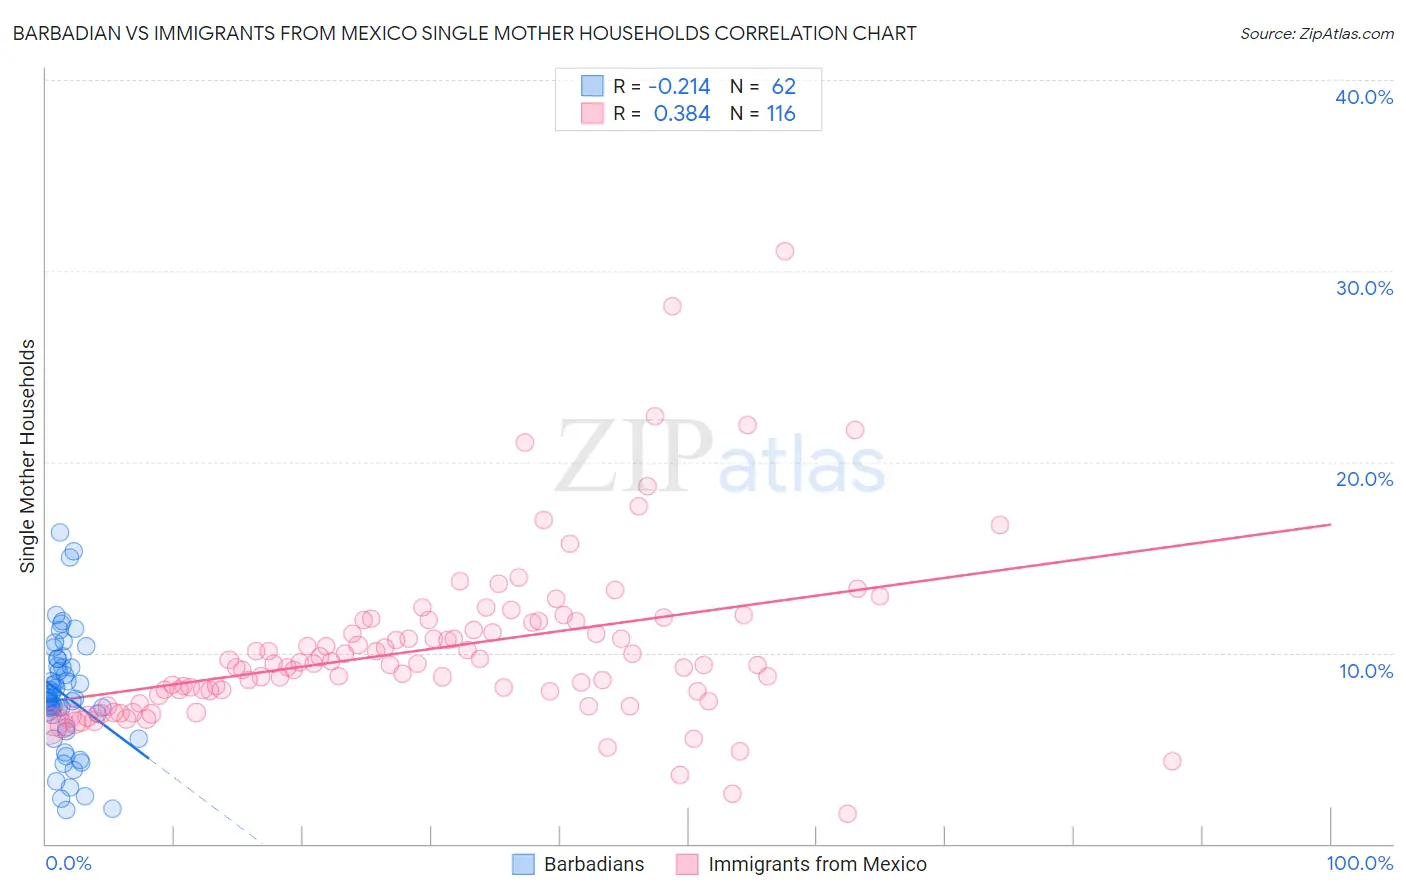
Barbadian vs Immigrants from Mexico Single Mother Households Correlation Chart
The statistical analysis conducted on geographies consisting of 141,217,581 people shows a weak negative correlation between the proportion of Barbadians and percentage of single mother households in the United States with a correlation coefficient (R) of -0.214 and weighted average of 7.9%. Similarly, the statistical analysis conducted on geographies consisting of 511,292,924 people shows a mild positive correlation between the proportion of Immigrants from Mexico and percentage of single mother households in the United States with a correlation coefficient (R) of 0.384 and weighted average of 8.2%, a difference of 3.3%.
Single Mother Households Correlation Summary
| Measurement | Barbadian | Immigrants from Mexico |
| Minimum | 1.8% | 1.6% |
| Maximum | 16.3% | 31.0% |
| Range | 14.6% | 29.5% |
| Mean | 7.8% | 10.2% |
| Median | 7.6% | 9.4% |
| Interquartile 25% (IQ1) | 6.1% | 7.9% |
| Interquartile 75% (IQ3) | 9.3% | 11.6% |
| Interquartile Range (IQR) | 3.2% | 3.7% |
| Standard Deviation (Sample) | 3.1% | 4.5% |
| Standard Deviation (Population) | 3.0% | 4.4% |
Demographics Similar to Barbadians and Immigrants from Mexico by Single Mother Households
In terms of single mother households, the demographic groups most similar to Barbadians are Immigrants from Latin America (7.9%, a difference of 0.060%), Hispanic or Latino (7.9%, a difference of 0.10%), Immigrants from West Indies (7.9%, a difference of 0.22%), Apache (7.9%, a difference of 0.29%), and Houma (7.9%, a difference of 0.30%). Similarly, the demographic groups most similar to Immigrants from Mexico are Immigrants from Grenada (8.2%, a difference of 0.12%), Bangladeshi (8.1%, a difference of 0.28%), Immigrants from Congo (8.1%, a difference of 0.57%), Honduran (8.1%, a difference of 0.87%), and Cheyenne (8.1%, a difference of 0.92%).
| Demographics | Rating | Rank | Single Mother Households |
| Apache | 0.0 /100 | #294 | Tragic 7.9% |
| Barbadians | 0.0 /100 | #295 | Tragic 7.9% |
| Immigrants | Latin America | 0.0 /100 | #296 | Tragic 7.9% |
| Hispanics or Latinos | 0.0 /100 | #297 | Tragic 7.9% |
| Immigrants | West Indies | 0.0 /100 | #298 | Tragic 7.9% |
| Houma | 0.0 /100 | #299 | Tragic 7.9% |
| Mexicans | 0.0 /100 | #300 | Tragic 8.0% |
| Chippewa | 0.0 /100 | #301 | Tragic 8.0% |
| Immigrants | Ghana | 0.0 /100 | #302 | Tragic 8.0% |
| Immigrants | Bahamas | 0.0 /100 | #303 | Tragic 8.0% |
| Natives/Alaskans | 0.0 /100 | #304 | Tragic 8.0% |
| Colville | 0.0 /100 | #305 | Tragic 8.0% |
| Immigrants | Barbados | 0.0 /100 | #306 | Tragic 8.0% |
| Immigrants | St. Vincent and the Grenadines | 0.0 /100 | #307 | Tragic 8.0% |
| Immigrants | Central America | 0.0 /100 | #308 | Tragic 8.1% |
| Cheyenne | 0.0 /100 | #309 | Tragic 8.1% |
| Hondurans | 0.0 /100 | #310 | Tragic 8.1% |
| Immigrants | Congo | 0.0 /100 | #311 | Tragic 8.1% |
| Bangladeshis | 0.0 /100 | #312 | Tragic 8.1% |
| Immigrants | Grenada | 0.0 /100 | #313 | Tragic 8.2% |
| Immigrants | Mexico | 0.0 /100 | #314 | Tragic 8.2% |