Bangladeshi vs Immigrants from Bahamas Divorced or Separated
COMPARE
Bangladeshi
Immigrants from Bahamas
Divorced or Separated
Divorced or Separated Comparison
Bangladeshis
Immigrants from Bahamas
12.3%
DIVORCED OR SEPARATED
10.5/ 100
METRIC RATING
222nd/ 347
METRIC RANK
13.9%
DIVORCED OR SEPARATED
0.0/ 100
METRIC RATING
334th/ 347
METRIC RANK
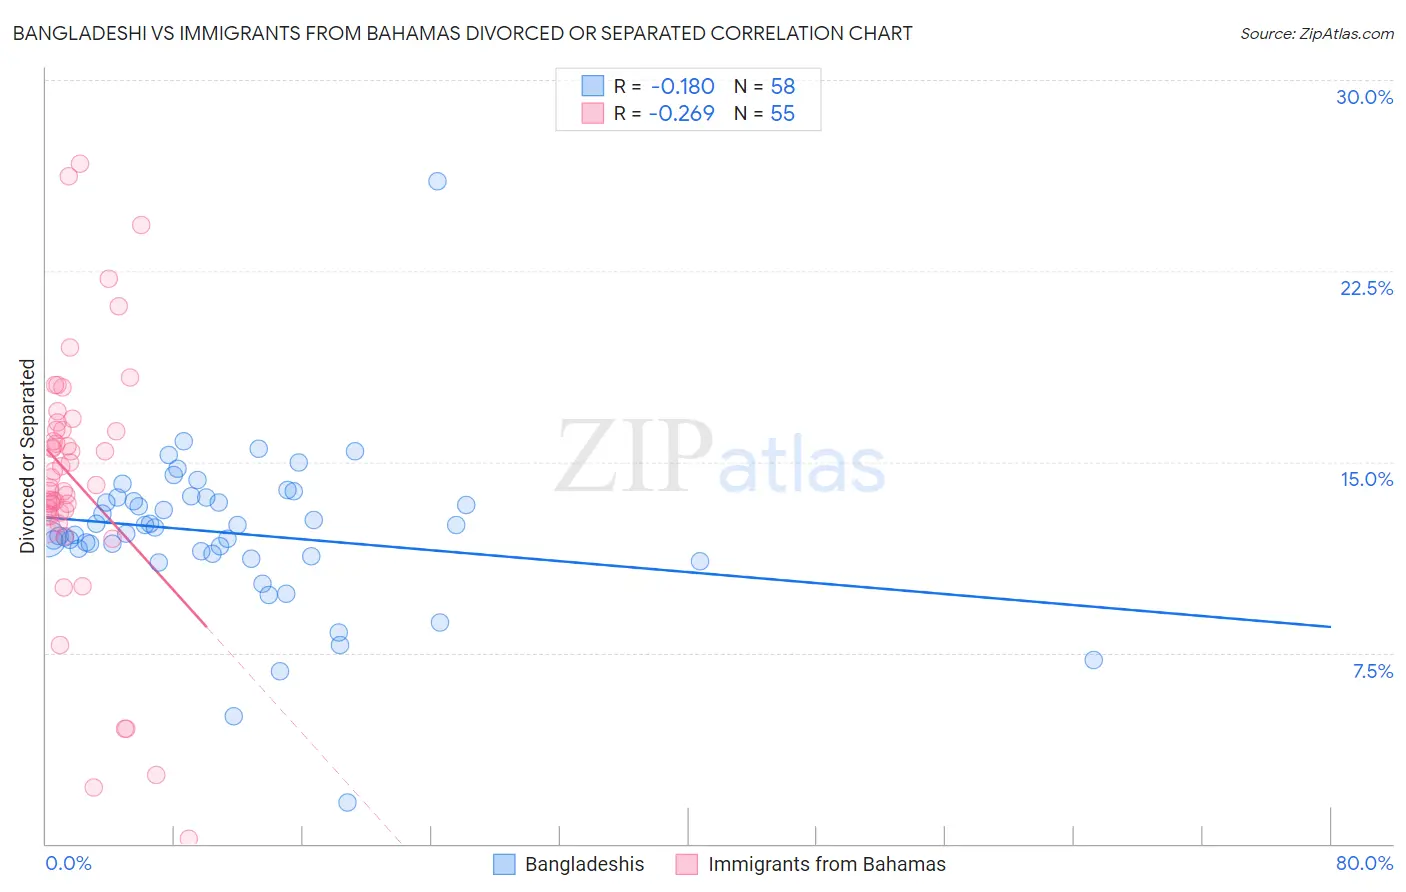
Bangladeshi vs Immigrants from Bahamas Divorced or Separated Correlation Chart
The statistical analysis conducted on geographies consisting of 141,409,827 people shows a poor negative correlation between the proportion of Bangladeshis and percentage of population currently divorced or separated in the United States with a correlation coefficient (R) of -0.180 and weighted average of 12.3%. Similarly, the statistical analysis conducted on geographies consisting of 104,629,880 people shows a weak negative correlation between the proportion of Immigrants from Bahamas and percentage of population currently divorced or separated in the United States with a correlation coefficient (R) of -0.269 and weighted average of 13.9%, a difference of 13.3%.
Divorced or Separated Correlation Summary
| Measurement | Bangladeshi | Immigrants from Bahamas |
| Minimum | 1.6% | 0.20% |
| Maximum | 26.0% | 26.7% |
| Range | 24.4% | 26.5% |
| Mean | 12.2% | 14.3% |
| Median | 12.3% | 14.1% |
| Interquartile 25% (IQ1) | 11.4% | 12.9% |
| Interquartile 75% (IQ3) | 13.6% | 16.3% |
| Interquartile Range (IQR) | 2.2% | 3.3% |
| Standard Deviation (Sample) | 3.2% | 5.1% |
| Standard Deviation (Population) | 3.1% | 5.1% |
Similar Demographics by Divorced or Separated
Demographics Similar to Bangladeshis by Divorced or Separated
In terms of divorced or separated, the demographic groups most similar to Bangladeshis are Scandinavian (12.3%, a difference of 0.010%), Guamanian/Chamorro (12.3%, a difference of 0.070%), Immigrants from the Azores (12.3%, a difference of 0.070%), Belgian (12.3%, a difference of 0.080%), and British (12.3%, a difference of 0.10%).
| Demographics | Rating | Rank | Divorced or Separated |
| Europeans | 15.4 /100 | #215 | Poor 12.2% |
| Immigrants | South America | 15.4 /100 | #216 | Poor 12.2% |
| Northern Europeans | 14.7 /100 | #217 | Poor 12.2% |
| Slovenes | 13.2 /100 | #218 | Poor 12.3% |
| Czechoslovakians | 11.7 /100 | #219 | Poor 12.3% |
| British | 11.6 /100 | #220 | Poor 12.3% |
| Guamanians/Chamorros | 11.3 /100 | #221 | Poor 12.3% |
| Bangladeshis | 10.5 /100 | #222 | Poor 12.3% |
| Scandinavians | 10.4 /100 | #223 | Poor 12.3% |
| Immigrants | Azores | 9.7 /100 | #224 | Tragic 12.3% |
| Belgians | 9.7 /100 | #225 | Tragic 12.3% |
| Immigrants | Western Africa | 9.3 /100 | #226 | Tragic 12.3% |
| Hmong | 8.8 /100 | #227 | Tragic 12.3% |
| Immigrants | Cameroon | 8.3 /100 | #228 | Tragic 12.3% |
| Immigrants | Sudan | 8.2 /100 | #229 | Tragic 12.3% |
Demographics Similar to Immigrants from Bahamas by Divorced or Separated
In terms of divorced or separated, the demographic groups most similar to Immigrants from Bahamas are Puerto Rican (13.9%, a difference of 0.34%), Dutch West Indian (14.0%, a difference of 0.60%), Shoshone (14.0%, a difference of 0.95%), Crow (14.1%, a difference of 1.2%), and Cherokee (13.7%, a difference of 1.3%).
| Demographics | Rating | Rank | Divorced or Separated |
| Comanche | 0.0 /100 | #327 | Tragic 13.5% |
| Immigrants | Caribbean | 0.0 /100 | #328 | Tragic 13.6% |
| Houma | 0.0 /100 | #329 | Tragic 13.6% |
| Paiute | 0.0 /100 | #330 | Tragic 13.6% |
| Blacks/African Americans | 0.0 /100 | #331 | Tragic 13.6% |
| Cherokee | 0.0 /100 | #332 | Tragic 13.7% |
| Puerto Ricans | 0.0 /100 | #333 | Tragic 13.9% |
| Immigrants | Bahamas | 0.0 /100 | #334 | Tragic 13.9% |
| Dutch West Indians | 0.0 /100 | #335 | Tragic 14.0% |
| Shoshone | 0.0 /100 | #336 | Tragic 14.0% |
| Crow | 0.0 /100 | #337 | Tragic 14.1% |
| Choctaw | 0.0 /100 | #338 | Tragic 14.1% |
| Colville | 0.0 /100 | #339 | Tragic 14.2% |
| Chickasaw | 0.0 /100 | #340 | Tragic 14.2% |
| Bahamians | 0.0 /100 | #341 | Tragic 14.2% |