Bangladeshi vs Immigrants from Belarus Divorced or Separated
COMPARE
Bangladeshi
Immigrants from Belarus
Divorced or Separated
Divorced or Separated Comparison
Bangladeshis
Immigrants from Belarus
12.3%
DIVORCED OR SEPARATED
10.5/ 100
METRIC RATING
222nd/ 347
METRIC RANK
11.2%
DIVORCED OR SEPARATED
100.0/ 100
METRIC RATING
43rd/ 347
METRIC RANK
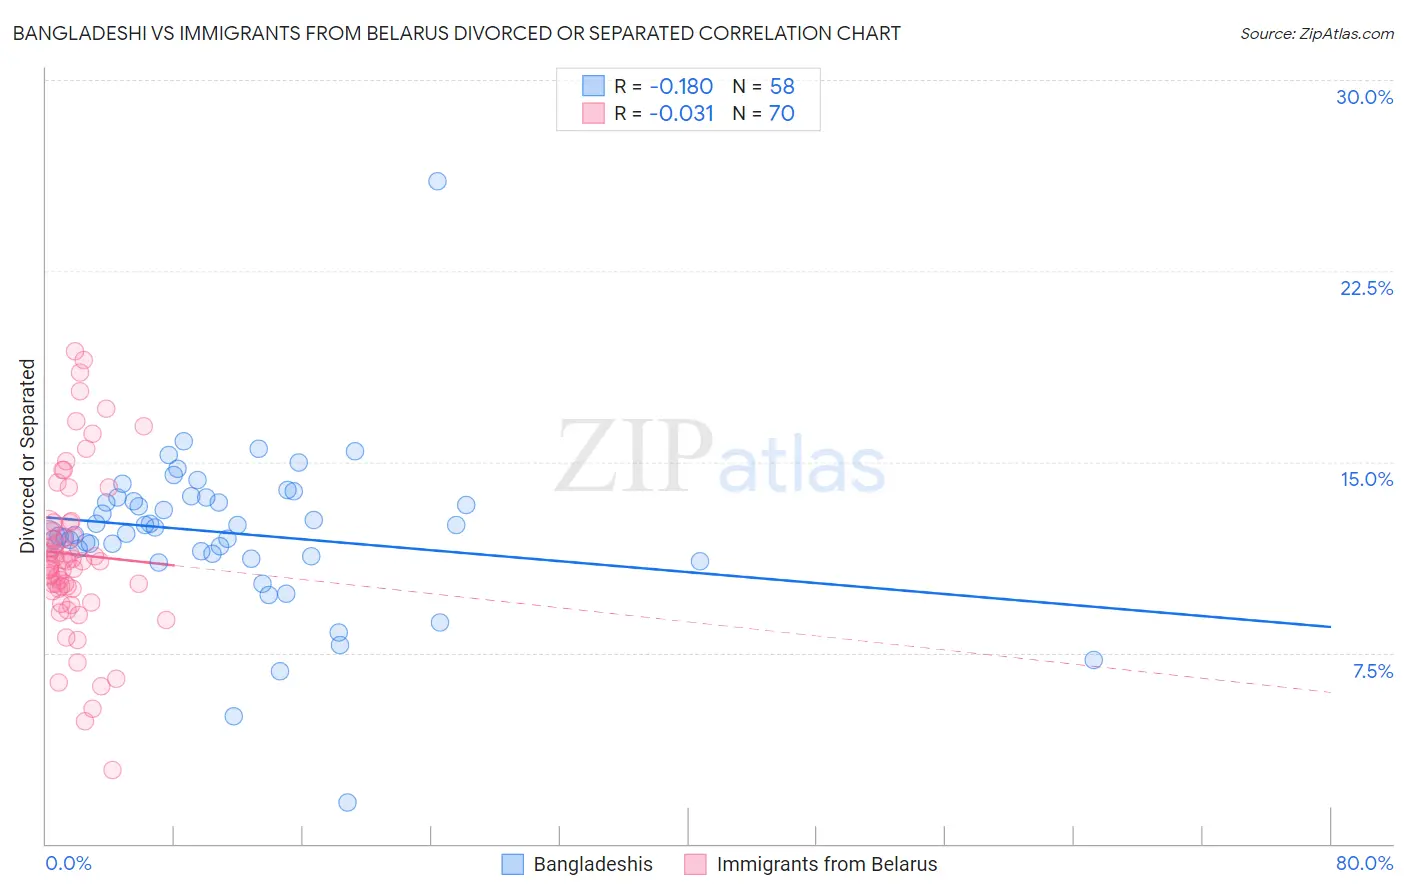
Bangladeshi vs Immigrants from Belarus Divorced or Separated Correlation Chart
The statistical analysis conducted on geographies consisting of 141,409,827 people shows a poor negative correlation between the proportion of Bangladeshis and percentage of population currently divorced or separated in the United States with a correlation coefficient (R) of -0.180 and weighted average of 12.3%. Similarly, the statistical analysis conducted on geographies consisting of 150,192,377 people shows no correlation between the proportion of Immigrants from Belarus and percentage of population currently divorced or separated in the United States with a correlation coefficient (R) of -0.031 and weighted average of 11.2%, a difference of 9.8%.
Divorced or Separated Correlation Summary
| Measurement | Bangladeshi | Immigrants from Belarus |
| Minimum | 1.6% | 2.9% |
| Maximum | 26.0% | 19.4% |
| Range | 24.4% | 16.5% |
| Mean | 12.2% | 11.4% |
| Median | 12.3% | 11.1% |
| Interquartile 25% (IQ1) | 11.4% | 10.0% |
| Interquartile 75% (IQ3) | 13.6% | 12.6% |
| Interquartile Range (IQR) | 2.2% | 2.6% |
| Standard Deviation (Sample) | 3.2% | 3.2% |
| Standard Deviation (Population) | 3.1% | 3.2% |
Similar Demographics by Divorced or Separated
Demographics Similar to Bangladeshis by Divorced or Separated
In terms of divorced or separated, the demographic groups most similar to Bangladeshis are Scandinavian (12.3%, a difference of 0.010%), Guamanian/Chamorro (12.3%, a difference of 0.070%), Immigrants from the Azores (12.3%, a difference of 0.070%), Belgian (12.3%, a difference of 0.080%), and British (12.3%, a difference of 0.10%).
| Demographics | Rating | Rank | Divorced or Separated |
| Europeans | 15.4 /100 | #215 | Poor 12.2% |
| Immigrants | South America | 15.4 /100 | #216 | Poor 12.2% |
| Northern Europeans | 14.7 /100 | #217 | Poor 12.2% |
| Slovenes | 13.2 /100 | #218 | Poor 12.3% |
| Czechoslovakians | 11.7 /100 | #219 | Poor 12.3% |
| British | 11.6 /100 | #220 | Poor 12.3% |
| Guamanians/Chamorros | 11.3 /100 | #221 | Poor 12.3% |
| Bangladeshis | 10.5 /100 | #222 | Poor 12.3% |
| Scandinavians | 10.4 /100 | #223 | Poor 12.3% |
| Immigrants | Azores | 9.7 /100 | #224 | Tragic 12.3% |
| Belgians | 9.7 /100 | #225 | Tragic 12.3% |
| Immigrants | Western Africa | 9.3 /100 | #226 | Tragic 12.3% |
| Hmong | 8.8 /100 | #227 | Tragic 12.3% |
| Immigrants | Cameroon | 8.3 /100 | #228 | Tragic 12.3% |
| Immigrants | Sudan | 8.2 /100 | #229 | Tragic 12.3% |
Demographics Similar to Immigrants from Belarus by Divorced or Separated
In terms of divorced or separated, the demographic groups most similar to Immigrants from Belarus are Chinese (11.2%, a difference of 0.010%), Immigrants from Western Asia (11.2%, a difference of 0.010%), Turkish (11.2%, a difference of 0.060%), Bhutanese (11.2%, a difference of 0.070%), and Laotian (11.2%, a difference of 0.17%).
| Demographics | Rating | Rank | Divorced or Separated |
| Immigrants | Japan | 100.0 /100 | #36 | Exceptional 11.1% |
| Immigrants | Lebanon | 100.0 /100 | #37 | Exceptional 11.1% |
| Immigrants | Greece | 100.0 /100 | #38 | Exceptional 11.1% |
| Immigrants | Egypt | 100.0 /100 | #39 | Exceptional 11.1% |
| Soviet Union | 100.0 /100 | #40 | Exceptional 11.1% |
| Bhutanese | 100.0 /100 | #41 | Exceptional 11.2% |
| Chinese | 100.0 /100 | #42 | Exceptional 11.2% |
| Immigrants | Belarus | 100.0 /100 | #43 | Exceptional 11.2% |
| Immigrants | Western Asia | 100.0 /100 | #44 | Exceptional 11.2% |
| Turks | 100.0 /100 | #45 | Exceptional 11.2% |
| Laotians | 100.0 /100 | #46 | Exceptional 11.2% |
| Immigrants | Poland | 100.0 /100 | #47 | Exceptional 11.2% |
| Immigrants | Turkey | 100.0 /100 | #48 | Exceptional 11.2% |
| Immigrants | Saudi Arabia | 100.0 /100 | #49 | Exceptional 11.2% |
| Bolivians | 100.0 /100 | #50 | Exceptional 11.2% |