Peruvian vs Immigrants from Bahamas Divorced or Separated
COMPARE
Peruvian
Immigrants from Bahamas
Divorced or Separated
Divorced or Separated Comparison
Peruvians
Immigrants from Bahamas
11.9%
DIVORCED OR SEPARATED
80.9/ 100
METRIC RATING
144th/ 347
METRIC RANK
13.9%
DIVORCED OR SEPARATED
0.0/ 100
METRIC RATING
334th/ 347
METRIC RANK
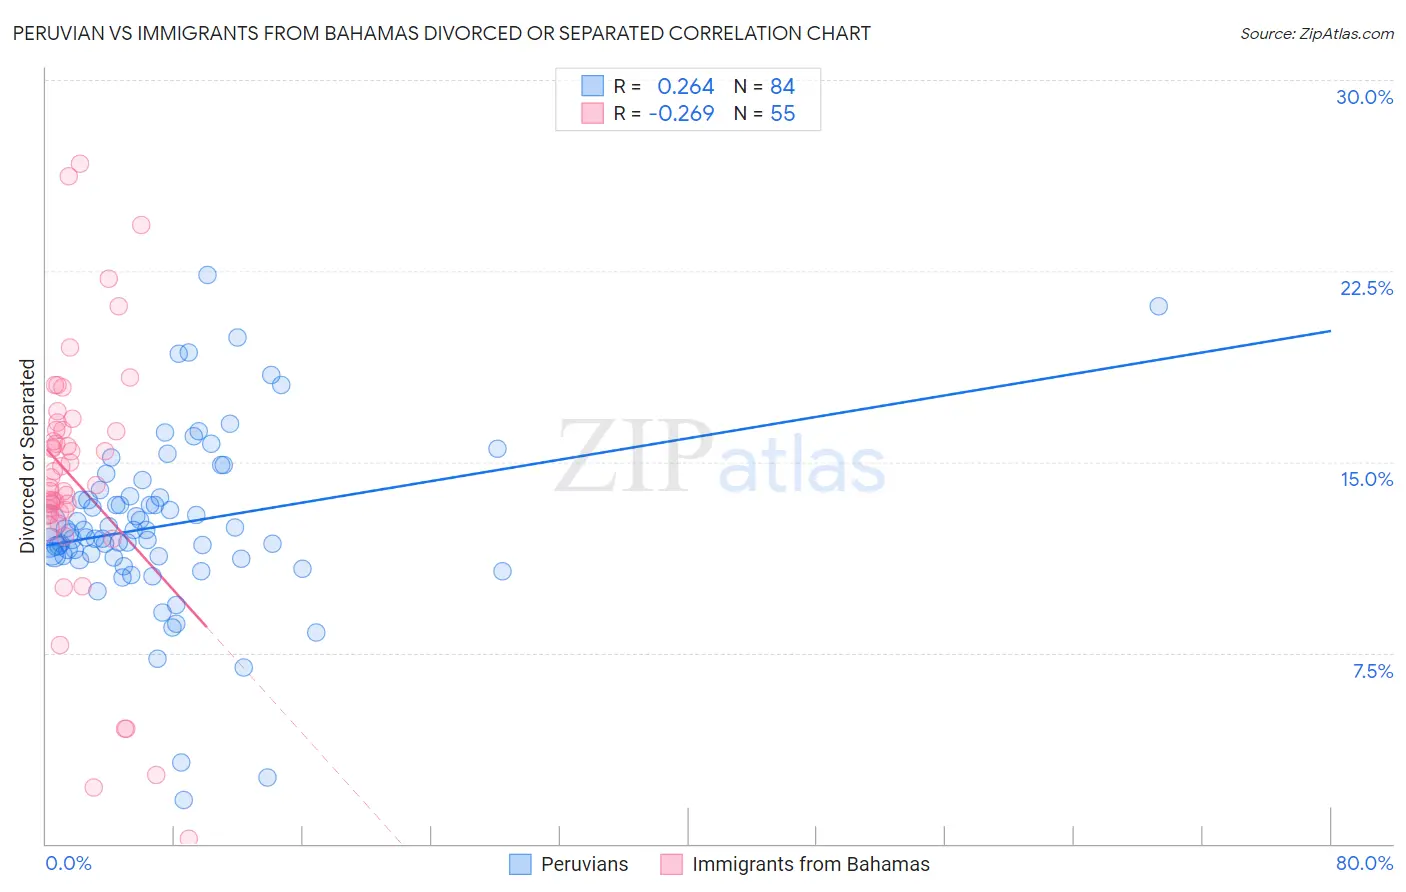
Peruvian vs Immigrants from Bahamas Divorced or Separated Correlation Chart
The statistical analysis conducted on geographies consisting of 363,080,575 people shows a weak positive correlation between the proportion of Peruvians and percentage of population currently divorced or separated in the United States with a correlation coefficient (R) of 0.264 and weighted average of 11.9%. Similarly, the statistical analysis conducted on geographies consisting of 104,629,880 people shows a weak negative correlation between the proportion of Immigrants from Bahamas and percentage of population currently divorced or separated in the United States with a correlation coefficient (R) of -0.269 and weighted average of 13.9%, a difference of 16.8%.
Divorced or Separated Correlation Summary
| Measurement | Peruvian | Immigrants from Bahamas |
| Minimum | 1.7% | 0.20% |
| Maximum | 22.4% | 26.7% |
| Range | 20.7% | 26.5% |
| Mean | 12.5% | 14.3% |
| Median | 12.1% | 14.1% |
| Interquartile 25% (IQ1) | 11.3% | 12.9% |
| Interquartile 75% (IQ3) | 13.6% | 16.3% |
| Interquartile Range (IQR) | 2.4% | 3.3% |
| Standard Deviation (Sample) | 3.4% | 5.1% |
| Standard Deviation (Population) | 3.4% | 5.1% |
Similar Demographics by Divorced or Separated
Demographics Similar to Peruvians by Divorced or Separated
In terms of divorced or separated, the demographic groups most similar to Peruvians are Croatian (11.9%, a difference of 0.020%), Immigrants from Zimbabwe (11.9%, a difference of 0.030%), Pakistani (11.9%, a difference of 0.030%), Immigrants from Grenada (11.9%, a difference of 0.10%), and Immigrants from Morocco (11.9%, a difference of 0.12%).
| Demographics | Rating | Rank | Divorced or Separated |
| Alsatians | 84.0 /100 | #137 | Excellent 11.9% |
| Immigrants | Netherlands | 83.9 /100 | #138 | Excellent 11.9% |
| Australians | 83.6 /100 | #139 | Excellent 11.9% |
| Lebanese | 83.4 /100 | #140 | Excellent 11.9% |
| Immigrants | Morocco | 82.9 /100 | #141 | Excellent 11.9% |
| Immigrants | Zimbabwe | 81.5 /100 | #142 | Excellent 11.9% |
| Pakistanis | 81.3 /100 | #143 | Excellent 11.9% |
| Peruvians | 80.9 /100 | #144 | Excellent 11.9% |
| Croatians | 80.6 /100 | #145 | Excellent 11.9% |
| Immigrants | Grenada | 79.1 /100 | #146 | Good 11.9% |
| Poles | 78.6 /100 | #147 | Good 11.9% |
| Italians | 77.8 /100 | #148 | Good 11.9% |
| Immigrants | Oceania | 77.7 /100 | #149 | Good 11.9% |
| Immigrants | Portugal | 77.3 /100 | #150 | Good 11.9% |
| Czechs | 76.4 /100 | #151 | Good 11.9% |
Demographics Similar to Immigrants from Bahamas by Divorced or Separated
In terms of divorced or separated, the demographic groups most similar to Immigrants from Bahamas are Puerto Rican (13.9%, a difference of 0.34%), Dutch West Indian (14.0%, a difference of 0.60%), Shoshone (14.0%, a difference of 0.95%), Crow (14.1%, a difference of 1.2%), and Cherokee (13.7%, a difference of 1.3%).
| Demographics | Rating | Rank | Divorced or Separated |
| Comanche | 0.0 /100 | #327 | Tragic 13.5% |
| Immigrants | Caribbean | 0.0 /100 | #328 | Tragic 13.6% |
| Houma | 0.0 /100 | #329 | Tragic 13.6% |
| Paiute | 0.0 /100 | #330 | Tragic 13.6% |
| Blacks/African Americans | 0.0 /100 | #331 | Tragic 13.6% |
| Cherokee | 0.0 /100 | #332 | Tragic 13.7% |
| Puerto Ricans | 0.0 /100 | #333 | Tragic 13.9% |
| Immigrants | Bahamas | 0.0 /100 | #334 | Tragic 13.9% |
| Dutch West Indians | 0.0 /100 | #335 | Tragic 14.0% |
| Shoshone | 0.0 /100 | #336 | Tragic 14.0% |
| Crow | 0.0 /100 | #337 | Tragic 14.1% |
| Choctaw | 0.0 /100 | #338 | Tragic 14.1% |
| Colville | 0.0 /100 | #339 | Tragic 14.2% |
| Chickasaw | 0.0 /100 | #340 | Tragic 14.2% |
| Bahamians | 0.0 /100 | #341 | Tragic 14.2% |