Bahamian vs Sierra Leonean Married-couple Households
COMPARE
Bahamian
Sierra Leonean
Married-couple Households
Married-couple Households Comparison
Bahamians
Sierra Leoneans
40.5%
MARRIED-COUPLE HOUSEHOLDS
0.0/ 100
METRIC RATING
319th/ 347
METRIC RANK
42.9%
MARRIED-COUPLE HOUSEHOLDS
0.0/ 100
METRIC RATING
279th/ 347
METRIC RANK
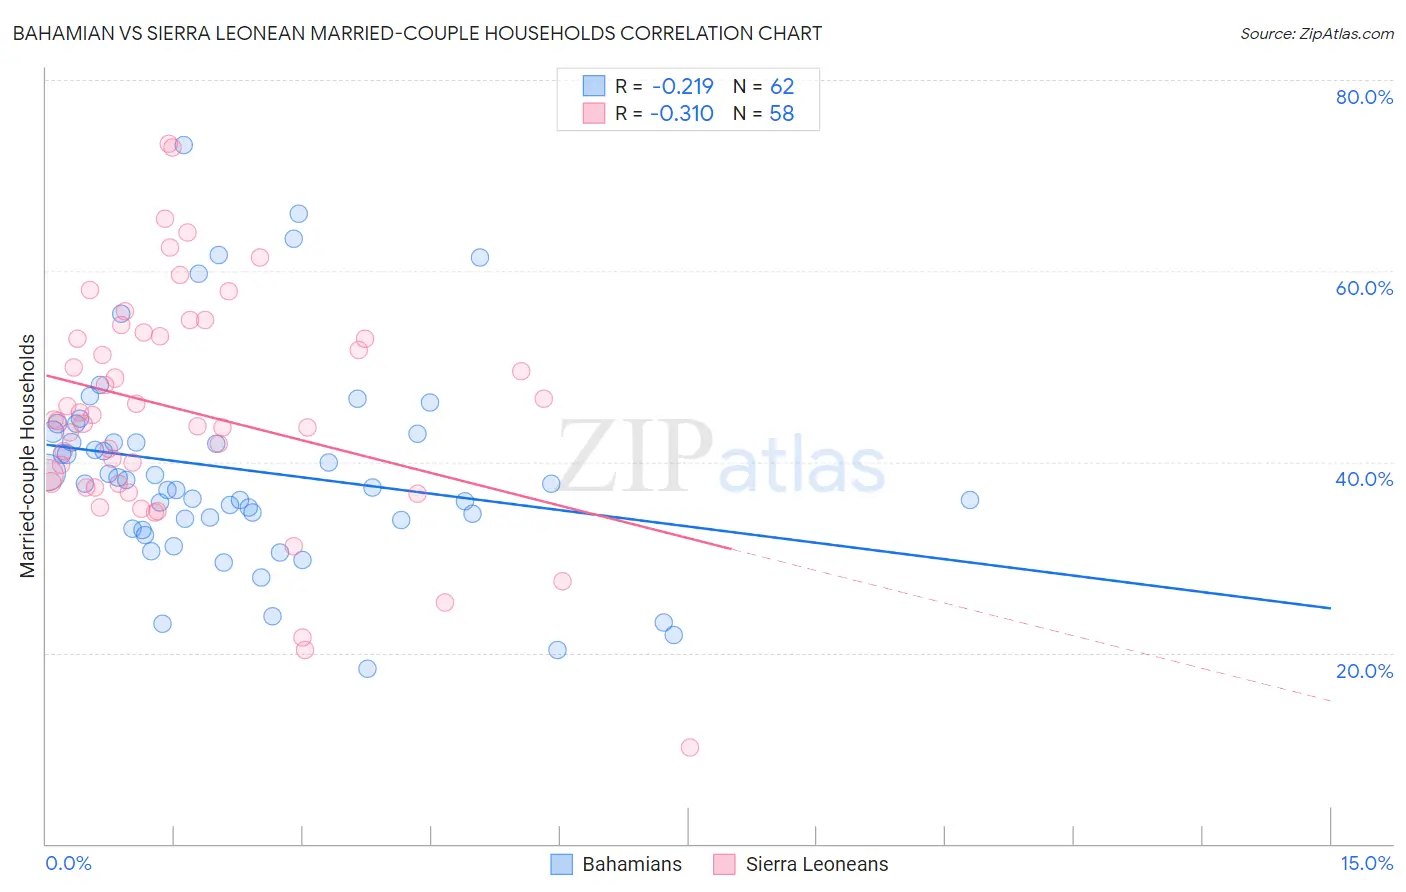
Bahamian vs Sierra Leonean Married-couple Households Correlation Chart
The statistical analysis conducted on geographies consisting of 112,634,221 people shows a weak negative correlation between the proportion of Bahamians and percentage of married-couple family households in the United States with a correlation coefficient (R) of -0.219 and weighted average of 40.5%. Similarly, the statistical analysis conducted on geographies consisting of 83,352,562 people shows a mild negative correlation between the proportion of Sierra Leoneans and percentage of married-couple family households in the United States with a correlation coefficient (R) of -0.310 and weighted average of 42.9%, a difference of 5.9%.
Married-couple Households Correlation Summary
| Measurement | Bahamian | Sierra Leonean |
| Minimum | 18.4% | 10.1% |
| Maximum | 73.1% | 73.4% |
| Range | 54.8% | 63.3% |
| Mean | 39.2% | 45.2% |
| Median | 37.7% | 44.4% |
| Interquartile 25% (IQ1) | 33.9% | 37.7% |
| Interquartile 75% (IQ3) | 42.9% | 53.1% |
| Interquartile Range (IQR) | 9.0% | 15.4% |
| Standard Deviation (Sample) | 10.9% | 12.2% |
| Standard Deviation (Population) | 10.8% | 12.1% |
Similar Demographics by Married-couple Households
Demographics Similar to Bahamians by Married-couple Households
In terms of married-couple households, the demographic groups most similar to Bahamians are Liberian (40.7%, a difference of 0.35%), Immigrants from Jamaica (40.7%, a difference of 0.36%), West Indian (40.3%, a difference of 0.42%), Immigrants from Liberia (40.3%, a difference of 0.45%), and Immigrants from Caribbean (40.8%, a difference of 0.65%).
| Demographics | Rating | Rank | Married-couple Households |
| Africans | 0.0 /100 | #312 | Tragic 40.9% |
| Immigrants | Haiti | 0.0 /100 | #313 | Tragic 40.9% |
| Jamaicans | 0.0 /100 | #314 | Tragic 40.9% |
| Trinidadians and Tobagonians | 0.0 /100 | #315 | Tragic 40.9% |
| Immigrants | Caribbean | 0.0 /100 | #316 | Tragic 40.8% |
| Immigrants | Jamaica | 0.0 /100 | #317 | Tragic 40.7% |
| Liberians | 0.0 /100 | #318 | Tragic 40.7% |
| Bahamians | 0.0 /100 | #319 | Tragic 40.5% |
| West Indians | 0.0 /100 | #320 | Tragic 40.3% |
| Immigrants | Liberia | 0.0 /100 | #321 | Tragic 40.3% |
| Immigrants | Zaire | 0.0 /100 | #322 | Tragic 40.1% |
| Puerto Ricans | 0.0 /100 | #323 | Tragic 40.1% |
| Navajo | 0.0 /100 | #324 | Tragic 40.1% |
| Pueblo | 0.0 /100 | #325 | Tragic 40.0% |
| U.S. Virgin Islanders | 0.0 /100 | #326 | Tragic 39.8% |
Demographics Similar to Sierra Leoneans by Married-couple Households
In terms of married-couple households, the demographic groups most similar to Sierra Leoneans are Immigrants from Africa (42.9%, a difference of 0.030%), Immigrants from Ecuador (42.9%, a difference of 0.050%), Immigrants from Guatemala (42.8%, a difference of 0.13%), Immigrants from Eastern Africa (42.9%, a difference of 0.14%), and Immigrants from Ethiopia (43.1%, a difference of 0.39%).
| Demographics | Rating | Rank | Married-couple Households |
| Immigrants | Nigeria | 0.1 /100 | #272 | Tragic 43.2% |
| Ethiopians | 0.1 /100 | #273 | Tragic 43.2% |
| Nigerians | 0.1 /100 | #274 | Tragic 43.2% |
| Immigrants | Bangladesh | 0.0 /100 | #275 | Tragic 43.1% |
| Immigrants | Ethiopia | 0.0 /100 | #276 | Tragic 43.1% |
| Immigrants | Eastern Africa | 0.0 /100 | #277 | Tragic 42.9% |
| Immigrants | Africa | 0.0 /100 | #278 | Tragic 42.9% |
| Sierra Leoneans | 0.0 /100 | #279 | Tragic 42.9% |
| Immigrants | Ecuador | 0.0 /100 | #280 | Tragic 42.9% |
| Immigrants | Guatemala | 0.0 /100 | #281 | Tragic 42.8% |
| Bermudans | 0.0 /100 | #282 | Tragic 42.4% |
| Inupiat | 0.0 /100 | #283 | Tragic 42.4% |
| Cheyenne | 0.0 /100 | #284 | Tragic 42.3% |
| Ghanaians | 0.0 /100 | #285 | Tragic 42.2% |
| Belizeans | 0.0 /100 | #286 | Tragic 42.2% |