Austrian vs Portuguese Divorced or Separated
COMPARE
Austrian
Portuguese
Divorced or Separated
Divorced or Separated Comparison
Austrians
Portuguese
12.0%
DIVORCED OR SEPARATED
72.2/ 100
METRIC RATING
153rd/ 347
METRIC RANK
12.2%
DIVORCED OR SEPARATED
23.5/ 100
METRIC RATING
202nd/ 347
METRIC RANK
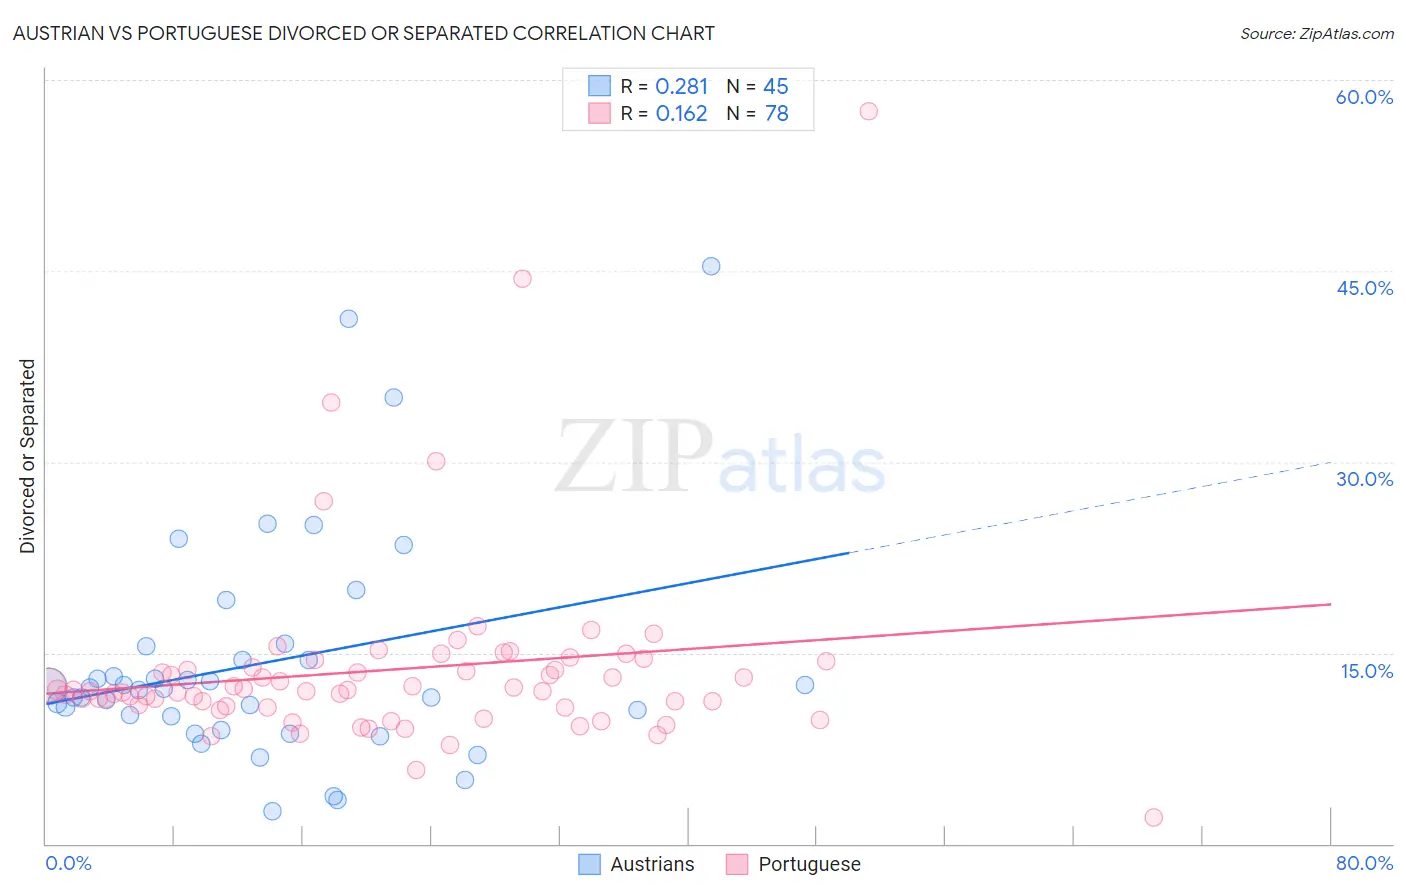
Austrian vs Portuguese Divorced or Separated Correlation Chart
The statistical analysis conducted on geographies consisting of 451,875,003 people shows a weak positive correlation between the proportion of Austrians and percentage of population currently divorced or separated in the United States with a correlation coefficient (R) of 0.281 and weighted average of 12.0%. Similarly, the statistical analysis conducted on geographies consisting of 450,104,326 people shows a poor positive correlation between the proportion of Portuguese and percentage of population currently divorced or separated in the United States with a correlation coefficient (R) of 0.162 and weighted average of 12.2%, a difference of 1.9%.
Divorced or Separated Correlation Summary
| Measurement | Austrian | Portuguese |
| Minimum | 2.6% | 2.1% |
| Maximum | 45.4% | 57.5% |
| Range | 42.8% | 55.4% |
| Mean | 14.2% | 13.6% |
| Median | 12.2% | 12.0% |
| Interquartile 25% (IQ1) | 9.5% | 10.8% |
| Interquartile 75% (IQ3) | 15.0% | 13.9% |
| Interquartile Range (IQR) | 5.5% | 3.1% |
| Standard Deviation (Sample) | 8.9% | 7.6% |
| Standard Deviation (Population) | 8.8% | 7.5% |
Similar Demographics by Divorced or Separated
Demographics Similar to Austrians by Divorced or Separated
In terms of divorced or separated, the demographic groups most similar to Austrians are Chilean (12.0%, a difference of 0.040%), Japanese (12.0%, a difference of 0.060%), Immigrants from Hungary (11.9%, a difference of 0.070%), Hungarian (12.0%, a difference of 0.080%), and Immigrants from Brazil (12.0%, a difference of 0.14%).
| Demographics | Rating | Rank | Divorced or Separated |
| Immigrants | Grenada | 79.1 /100 | #146 | Good 11.9% |
| Poles | 78.6 /100 | #147 | Good 11.9% |
| Italians | 77.8 /100 | #148 | Good 11.9% |
| Immigrants | Oceania | 77.7 /100 | #149 | Good 11.9% |
| Immigrants | Portugal | 77.3 /100 | #150 | Good 11.9% |
| Czechs | 76.4 /100 | #151 | Good 11.9% |
| Immigrants | Hungary | 73.7 /100 | #152 | Good 11.9% |
| Austrians | 72.2 /100 | #153 | Good 12.0% |
| Chileans | 71.3 /100 | #154 | Good 12.0% |
| Japanese | 70.9 /100 | #155 | Good 12.0% |
| Hungarians | 70.3 /100 | #156 | Good 12.0% |
| Immigrants | Brazil | 68.8 /100 | #157 | Good 12.0% |
| Icelanders | 66.0 /100 | #158 | Good 12.0% |
| Immigrants | Barbados | 66.0 /100 | #159 | Good 12.0% |
| Immigrants | Scotland | 65.8 /100 | #160 | Good 12.0% |
Demographics Similar to Portuguese by Divorced or Separated
In terms of divorced or separated, the demographic groups most similar to Portuguese are Immigrants from Guatemala (12.2%, a difference of 0.020%), Kenyan (12.2%, a difference of 0.080%), Immigrants from Costa Rica (12.2%, a difference of 0.11%), Slovak (12.2%, a difference of 0.12%), and Mexican (12.2%, a difference of 0.13%).
| Demographics | Rating | Rank | Divorced or Separated |
| Immigrants | England | 31.4 /100 | #195 | Fair 12.1% |
| Immigrants | Burma/Myanmar | 30.4 /100 | #196 | Fair 12.1% |
| Immigrants | Africa | 30.3 /100 | #197 | Fair 12.1% |
| Nigerians | 30.1 /100 | #198 | Fair 12.1% |
| Central Americans | 29.4 /100 | #199 | Fair 12.1% |
| South Americans | 28.6 /100 | #200 | Fair 12.2% |
| Guatemalans | 26.9 /100 | #201 | Fair 12.2% |
| Portuguese | 23.5 /100 | #202 | Fair 12.2% |
| Immigrants | Guatemala | 23.2 /100 | #203 | Fair 12.2% |
| Kenyans | 21.8 /100 | #204 | Fair 12.2% |
| Immigrants | Costa Rica | 21.3 /100 | #205 | Fair 12.2% |
| Slovaks | 21.0 /100 | #206 | Fair 12.2% |
| Mexicans | 21.0 /100 | #207 | Fair 12.2% |
| Immigrants | Ghana | 18.8 /100 | #208 | Poor 12.2% |
| Immigrants | Trinidad and Tobago | 17.8 /100 | #209 | Poor 12.2% |