Australian vs Egyptian Single Father Households
COMPARE
Australian
Egyptian
Single Father Households
Single Father Households Comparison
Australians
Egyptians
2.2%
SINGLE FATHER HOUSEHOLDS
97.7/ 100
METRIC RATING
120th/ 347
METRIC RANK
2.1%
SINGLE FATHER HOUSEHOLDS
99.8/ 100
METRIC RATING
70th/ 347
METRIC RANK
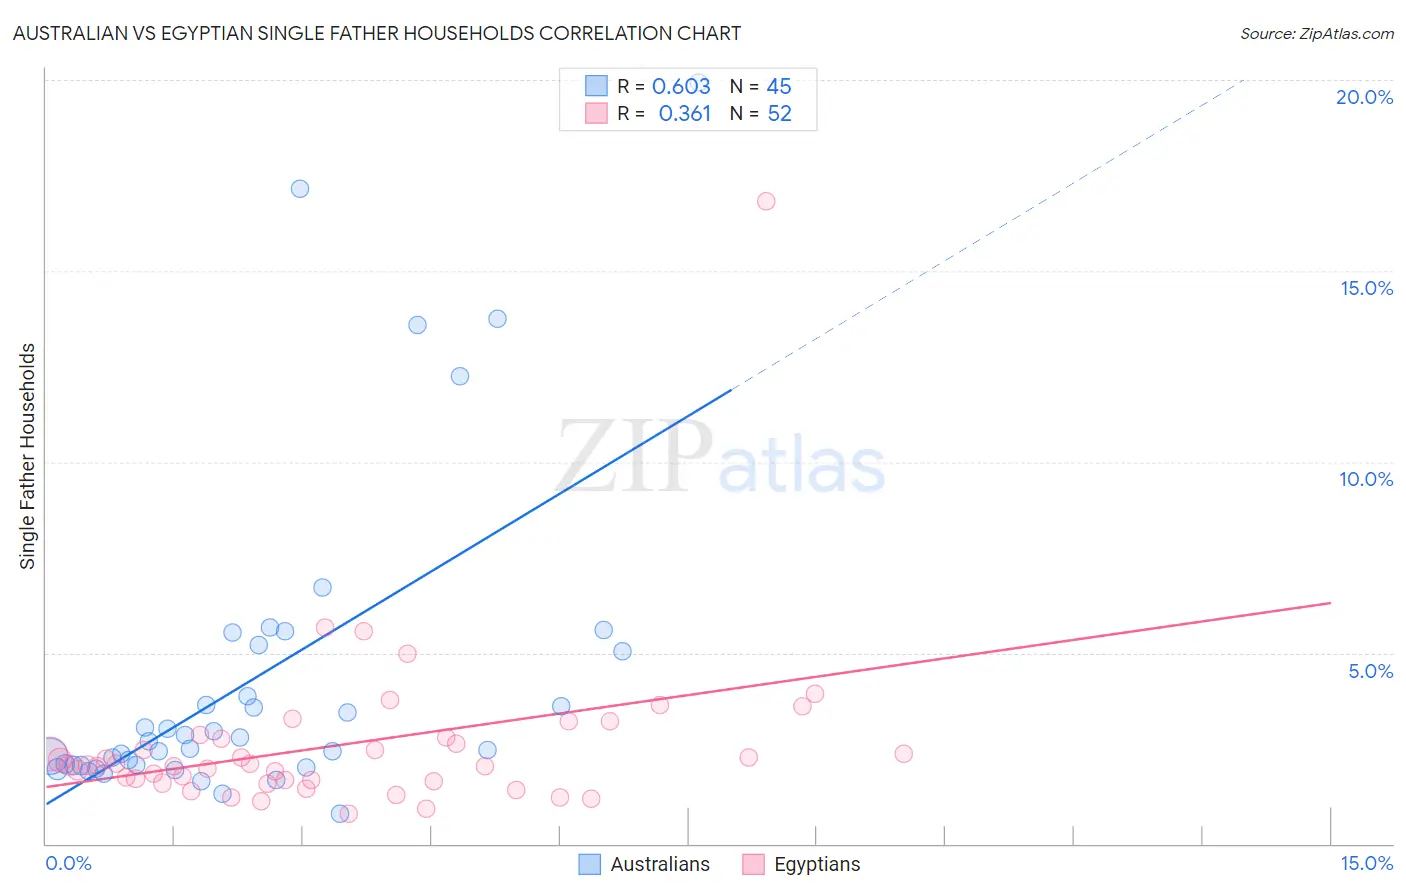
Australian vs Egyptian Single Father Households Correlation Chart
The statistical analysis conducted on geographies consisting of 222,691,289 people shows a significant positive correlation between the proportion of Australians and percentage of single father households in the United States with a correlation coefficient (R) of 0.603 and weighted average of 2.2%. Similarly, the statistical analysis conducted on geographies consisting of 275,347,548 people shows a mild positive correlation between the proportion of Egyptians and percentage of single father households in the United States with a correlation coefficient (R) of 0.361 and weighted average of 2.1%, a difference of 5.2%.
Single Father Households Correlation Summary
| Measurement | Australian | Egyptian |
| Minimum | 0.78% | 0.77% |
| Maximum | 19.9% | 16.8% |
| Range | 19.2% | 16.1% |
| Mean | 4.3% | 2.6% |
| Median | 2.7% | 2.1% |
| Interquartile 25% (IQ1) | 2.0% | 1.7% |
| Interquartile 75% (IQ3) | 5.1% | 2.8% |
| Interquartile Range (IQR) | 3.1% | 1.1% |
| Standard Deviation (Sample) | 4.3% | 2.3% |
| Standard Deviation (Population) | 4.2% | 2.3% |
Similar Demographics by Single Father Households
Demographics Similar to Australians by Single Father Households
In terms of single father households, the demographic groups most similar to Australians are Immigrants from Brazil (2.2%, a difference of 0.0%), Trinidadian and Tobagonian (2.2%, a difference of 0.030%), Immigrants from Morocco (2.2%, a difference of 0.090%), Immigrants from Iraq (2.2%, a difference of 0.10%), and Hungarian (2.2%, a difference of 0.19%).
| Demographics | Rating | Rank | Single Father Households |
| Iraqis | 98.2 /100 | #113 | Exceptional 2.2% |
| Immigrants | North America | 98.2 /100 | #114 | Exceptional 2.2% |
| Immigrants | Barbados | 98.2 /100 | #115 | Exceptional 2.2% |
| Immigrants | Argentina | 98.1 /100 | #116 | Exceptional 2.2% |
| Hungarians | 97.9 /100 | #117 | Exceptional 2.2% |
| Immigrants | Morocco | 97.8 /100 | #118 | Exceptional 2.2% |
| Trinidadians and Tobagonians | 97.8 /100 | #119 | Exceptional 2.2% |
| Australians | 97.7 /100 | #120 | Exceptional 2.2% |
| Immigrants | Brazil | 97.7 /100 | #121 | Exceptional 2.2% |
| Immigrants | Iraq | 97.6 /100 | #122 | Exceptional 2.2% |
| Immigrants | Yemen | 97.5 /100 | #123 | Exceptional 2.2% |
| British West Indians | 97.4 /100 | #124 | Exceptional 2.2% |
| Immigrants | Indonesia | 97.4 /100 | #125 | Exceptional 2.2% |
| Moroccans | 96.9 /100 | #126 | Exceptional 2.2% |
| Jordanians | 96.9 /100 | #127 | Exceptional 2.2% |
Demographics Similar to Egyptians by Single Father Households
In terms of single father households, the demographic groups most similar to Egyptians are Immigrants from Kuwait (2.1%, a difference of 0.010%), Immigrants from Spain (2.1%, a difference of 0.020%), Immigrants from Bangladesh (2.1%, a difference of 0.16%), Immigrants from Egypt (2.1%, a difference of 0.16%), and Immigrants from Romania (2.1%, a difference of 0.21%).
| Demographics | Rating | Rank | Single Father Households |
| Maltese | 99.9 /100 | #63 | Exceptional 2.0% |
| Mongolians | 99.9 /100 | #64 | Exceptional 2.1% |
| Paraguayans | 99.9 /100 | #65 | Exceptional 2.1% |
| Immigrants | Western Asia | 99.8 /100 | #66 | Exceptional 2.1% |
| Immigrants | Italy | 99.8 /100 | #67 | Exceptional 2.1% |
| Immigrants | Denmark | 99.8 /100 | #68 | Exceptional 2.1% |
| Immigrants | Romania | 99.8 /100 | #69 | Exceptional 2.1% |
| Egyptians | 99.8 /100 | #70 | Exceptional 2.1% |
| Immigrants | Kuwait | 99.8 /100 | #71 | Exceptional 2.1% |
| Immigrants | Spain | 99.8 /100 | #72 | Exceptional 2.1% |
| Immigrants | Bangladesh | 99.8 /100 | #73 | Exceptional 2.1% |
| Immigrants | Egypt | 99.8 /100 | #74 | Exceptional 2.1% |
| Immigrants | Sweden | 99.8 /100 | #75 | Exceptional 2.1% |
| Immigrants | Scotland | 99.8 /100 | #76 | Exceptional 2.1% |
| Immigrants | Saudi Arabia | 99.8 /100 | #77 | Exceptional 2.1% |