Australian vs Immigrants from Argentina Births to Unmarried Women
COMPARE
Australian
Immigrants from Argentina
Births to Unmarried Women
Births to Unmarried Women Comparison
Australians
Immigrants from Argentina
29.5%
BIRTHS TO UNMARRIED WOMEN
94.6/ 100
METRIC RATING
102nd/ 347
METRIC RANK
30.1%
BIRTHS TO UNMARRIED WOMEN
88.7/ 100
METRIC RATING
122nd/ 347
METRIC RANK
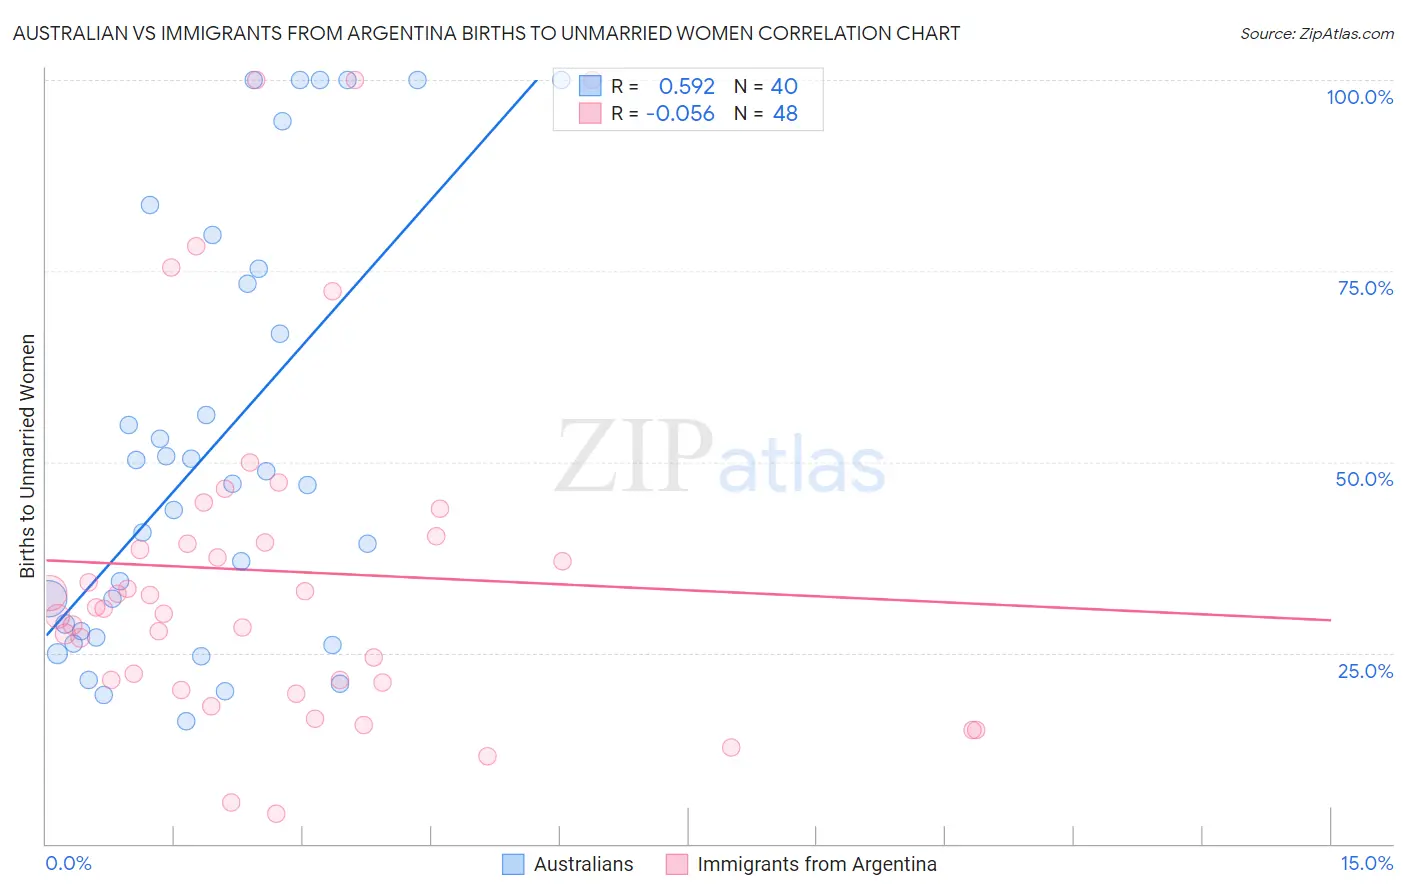
Australian vs Immigrants from Argentina Births to Unmarried Women Correlation Chart
The statistical analysis conducted on geographies consisting of 212,996,225 people shows a substantial positive correlation between the proportion of Australians and percentage of births to unmarried women in the United States with a correlation coefficient (R) of 0.592 and weighted average of 29.5%. Similarly, the statistical analysis conducted on geographies consisting of 249,724,782 people shows a slight negative correlation between the proportion of Immigrants from Argentina and percentage of births to unmarried women in the United States with a correlation coefficient (R) of -0.056 and weighted average of 30.1%, a difference of 2.0%.
Births to Unmarried Women Correlation Summary
| Measurement | Australian | Immigrants from Argentina |
| Minimum | 16.0% | 4.0% |
| Maximum | 100.0% | 100.0% |
| Range | 84.0% | 96.0% |
| Mean | 51.9% | 35.7% |
| Median | 47.1% | 30.9% |
| Interquartile 25% (IQ1) | 27.4% | 21.2% |
| Interquartile 75% (IQ3) | 74.3% | 39.8% |
| Interquartile Range (IQR) | 46.9% | 18.5% |
| Standard Deviation (Sample) | 27.9% | 22.9% |
| Standard Deviation (Population) | 27.5% | 22.7% |
Demographics Similar to Australians and Immigrants from Argentina by Births to Unmarried Women
In terms of births to unmarried women, the demographic groups most similar to Australians are Lebanese (29.5%, a difference of 0.050%), Lithuanian (29.6%, a difference of 0.060%), Immigrants from Nepal (29.6%, a difference of 0.11%), Swedish (29.6%, a difference of 0.37%), and Immigrants from Brazil (29.6%, a difference of 0.38%). Similarly, the demographic groups most similar to Immigrants from Argentina are Korean (30.1%, a difference of 0.050%), Ugandan (30.1%, a difference of 0.12%), Argentinean (30.0%, a difference of 0.48%), Immigrants from Norway (29.9%, a difference of 0.62%), and Immigrants from Netherlands (29.9%, a difference of 0.64%).
| Demographics | Rating | Rank | Births to Unmarried Women |
| Australians | 94.6 /100 | #102 | Exceptional 29.5% |
| Lebanese | 94.4 /100 | #103 | Exceptional 29.5% |
| Lithuanians | 94.4 /100 | #104 | Exceptional 29.6% |
| Immigrants | Nepal | 94.3 /100 | #105 | Exceptional 29.6% |
| Swedes | 93.8 /100 | #106 | Exceptional 29.6% |
| Immigrants | Brazil | 93.7 /100 | #107 | Exceptional 29.6% |
| Paraguayans | 93.5 /100 | #108 | Exceptional 29.7% |
| Greeks | 93.4 /100 | #109 | Exceptional 29.7% |
| Immigrants | Ethiopia | 93.4 /100 | #110 | Exceptional 29.7% |
| Immigrants | Hungary | 93.0 /100 | #111 | Exceptional 29.7% |
| Basques | 93.0 /100 | #112 | Exceptional 29.7% |
| Scandinavians | 92.7 /100 | #113 | Exceptional 29.8% |
| Immigrants | Croatia | 92.6 /100 | #114 | Exceptional 29.8% |
| Ethiopians | 91.9 /100 | #115 | Exceptional 29.8% |
| Immigrants | Italy | 91.7 /100 | #116 | Exceptional 29.9% |
| Immigrants | Netherlands | 91.1 /100 | #117 | Exceptional 29.9% |
| Immigrants | Norway | 91.0 /100 | #118 | Exceptional 29.9% |
| Argentineans | 90.5 /100 | #119 | Exceptional 30.0% |
| Ugandans | 89.2 /100 | #120 | Excellent 30.1% |
| Koreans | 88.9 /100 | #121 | Excellent 30.1% |
| Immigrants | Argentina | 88.7 /100 | #122 | Excellent 30.1% |