Estonian vs Immigrants from Sweden Single Mother Households
COMPARE
Estonian
Immigrants from Sweden
Single Mother Households
Single Mother Households Comparison
Estonians
Immigrants from Sweden
5.4%
SINGLE MOTHER HOUSEHOLDS
99.6/ 100
METRIC RATING
40th/ 347
METRIC RANK
5.4%
SINGLE MOTHER HOUSEHOLDS
99.6/ 100
METRIC RATING
39th/ 347
METRIC RANK
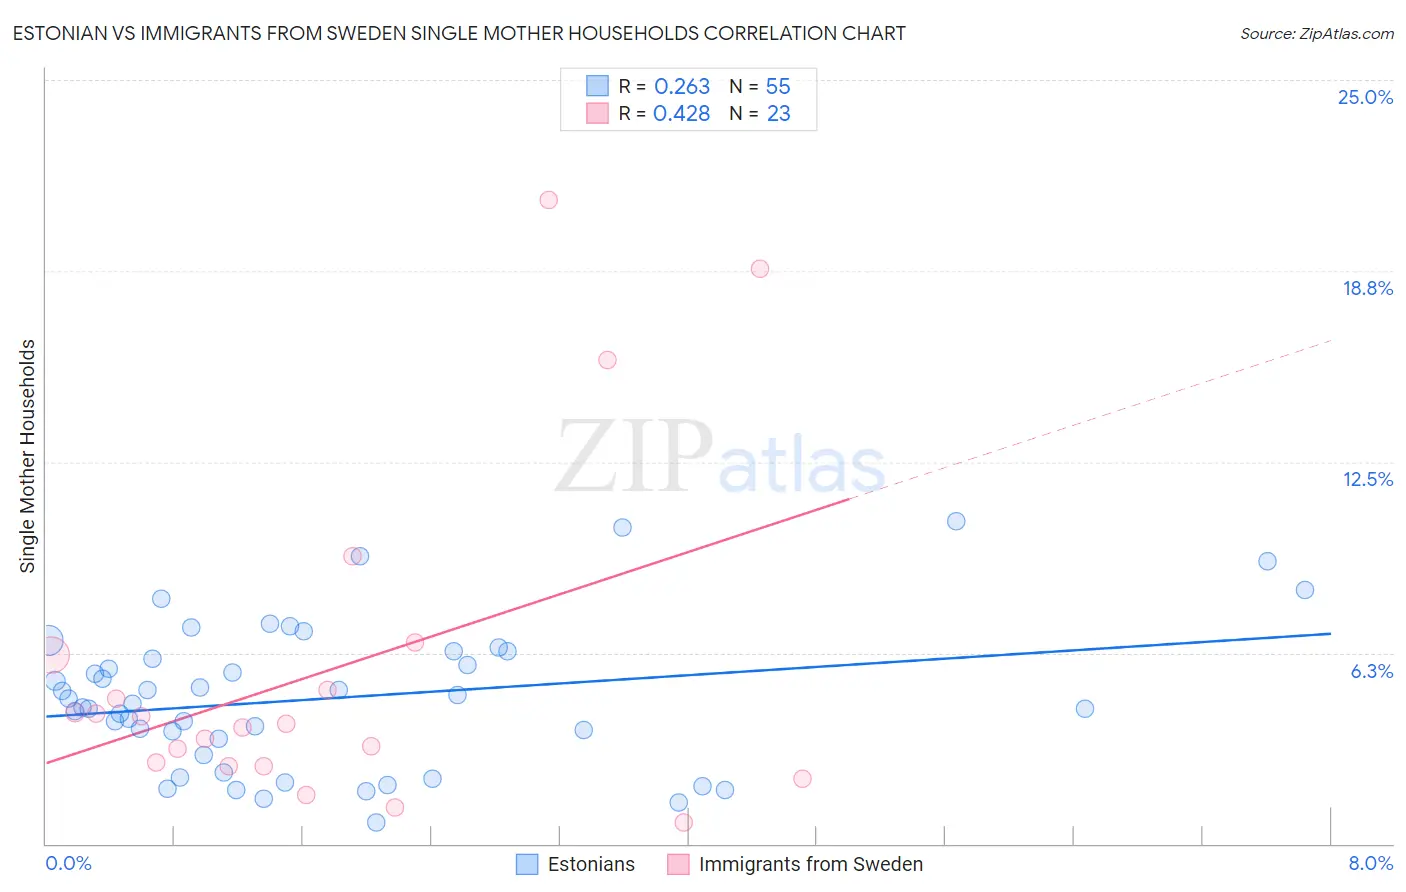
Estonian vs Immigrants from Sweden Single Mother Households Correlation Chart
The statistical analysis conducted on geographies consisting of 123,346,647 people shows a weak positive correlation between the proportion of Estonians and percentage of single mother households in the United States with a correlation coefficient (R) of 0.263 and weighted average of 5.4%. Similarly, the statistical analysis conducted on geographies consisting of 164,354,075 people shows a moderate positive correlation between the proportion of Immigrants from Sweden and percentage of single mother households in the United States with a correlation coefficient (R) of 0.428 and weighted average of 5.4%, a difference of 0.11%.
Single Mother Households Correlation Summary
| Measurement | Estonian | Immigrants from Sweden |
| Minimum | 0.68% | 0.71% |
| Maximum | 10.6% | 21.1% |
| Range | 9.9% | 20.3% |
| Mean | 4.8% | 5.7% |
| Median | 4.6% | 3.9% |
| Interquartile 25% (IQ1) | 2.9% | 2.5% |
| Interquartile 75% (IQ3) | 6.3% | 6.2% |
| Interquartile Range (IQR) | 3.4% | 3.7% |
| Standard Deviation (Sample) | 2.4% | 5.5% |
| Standard Deviation (Population) | 2.3% | 5.4% |
Demographics Similar to Estonians and Immigrants from Sweden by Single Mother Households
In terms of single mother households, the demographic groups most similar to Estonians are Immigrants from Serbia (5.4%, a difference of 0.25%), Immigrants from Greece (5.4%, a difference of 0.42%), Macedonian (5.4%, a difference of 0.50%), Immigrants from South Central Asia (5.4%, a difference of 0.56%), and Immigrants from Belgium (5.3%, a difference of 0.69%). Similarly, the demographic groups most similar to Immigrants from Sweden are Immigrants from Serbia (5.4%, a difference of 0.14%), Immigrants from Greece (5.4%, a difference of 0.53%), Immigrants from Belgium (5.3%, a difference of 0.58%), Macedonian (5.4%, a difference of 0.61%), and Immigrants from South Central Asia (5.4%, a difference of 0.67%).
| Demographics | Rating | Rank | Single Mother Households |
| Latvians | 99.7 /100 | #29 | Exceptional 5.3% |
| Burmese | 99.7 /100 | #30 | Exceptional 5.3% |
| Immigrants | Korea | 99.7 /100 | #31 | Exceptional 5.3% |
| Cambodians | 99.7 /100 | #32 | Exceptional 5.3% |
| Immigrants | Switzerland | 99.7 /100 | #33 | Exceptional 5.3% |
| Bulgarians | 99.7 /100 | #34 | Exceptional 5.3% |
| Immigrants | Northern Europe | 99.7 /100 | #35 | Exceptional 5.3% |
| Immigrants | Czechoslovakia | 99.7 /100 | #36 | Exceptional 5.3% |
| Immigrants | Belgium | 99.7 /100 | #37 | Exceptional 5.3% |
| Immigrants | Serbia | 99.6 /100 | #38 | Exceptional 5.4% |
| Immigrants | Sweden | 99.6 /100 | #39 | Exceptional 5.4% |
| Estonians | 99.6 /100 | #40 | Exceptional 5.4% |
| Immigrants | Greece | 99.5 /100 | #41 | Exceptional 5.4% |
| Macedonians | 99.5 /100 | #42 | Exceptional 5.4% |
| Immigrants | South Central Asia | 99.5 /100 | #43 | Exceptional 5.4% |
| Lithuanians | 99.4 /100 | #44 | Exceptional 5.4% |
| Immigrants | Croatia | 99.4 /100 | #45 | Exceptional 5.4% |
| Croatians | 99.3 /100 | #46 | Exceptional 5.5% |
| Norwegians | 99.3 /100 | #47 | Exceptional 5.5% |
| Turks | 99.2 /100 | #48 | Exceptional 5.5% |
| Immigrants | Latvia | 99.2 /100 | #49 | Exceptional 5.5% |