Nigerian vs Immigrants from Peru Family Households with Children
COMPARE
Nigerian
Immigrants from Peru
Family Households with Children
Family Households with Children Comparison
Nigerians
Immigrants from Peru
28.4%
FAMILY HOUSEHOLDS WITH CHILDREN
99.8/ 100
METRIC RATING
77th/ 347
METRIC RANK
28.9%
FAMILY HOUSEHOLDS WITH CHILDREN
100.0/ 100
METRIC RATING
51st/ 347
METRIC RANK
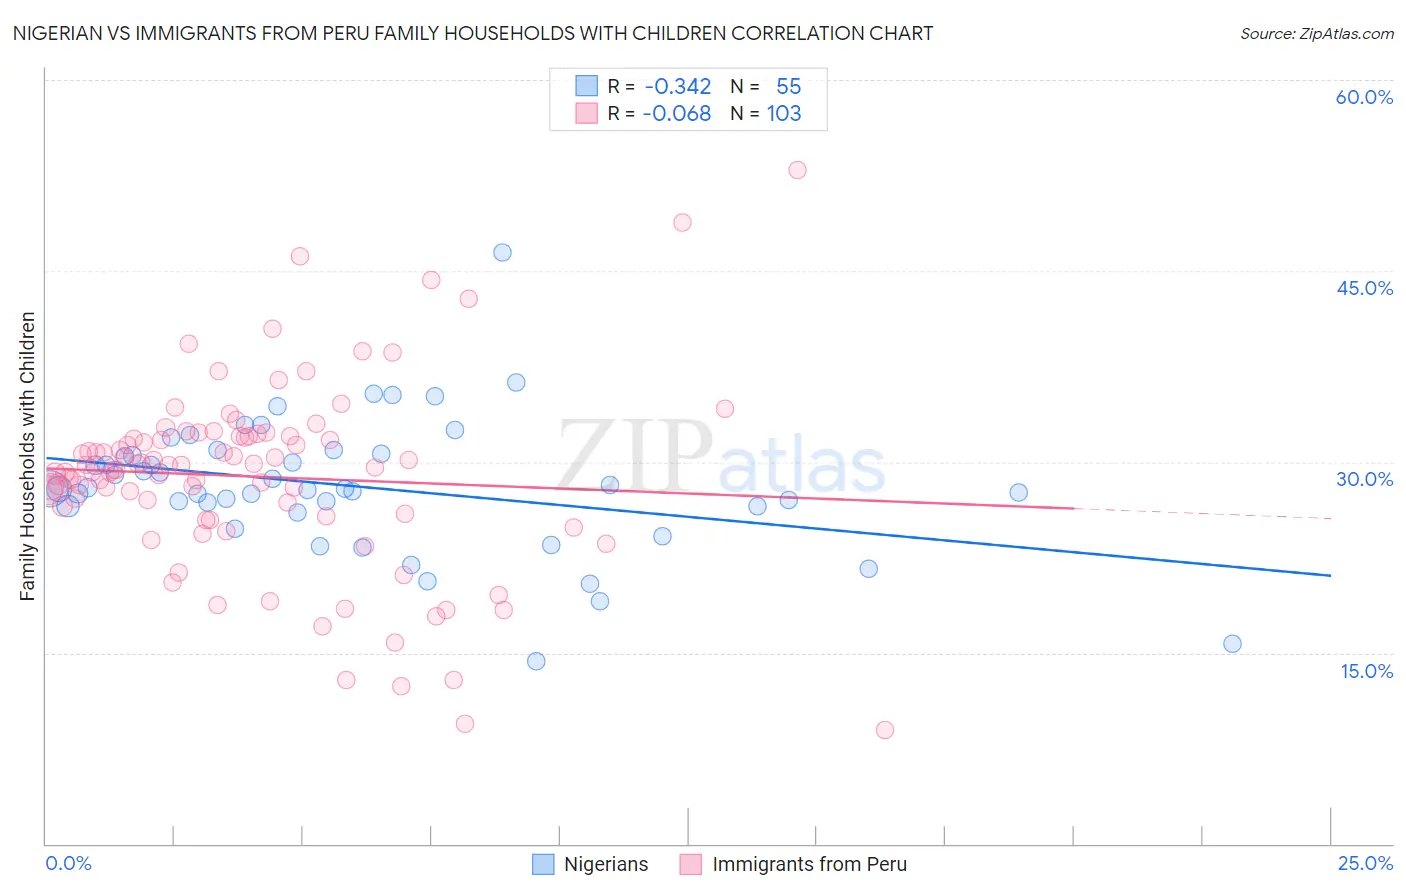
Nigerian vs Immigrants from Peru Family Households with Children Correlation Chart
The statistical analysis conducted on geographies consisting of 332,387,901 people shows a mild negative correlation between the proportion of Nigerians and percentage of family households with children in the United States with a correlation coefficient (R) of -0.342 and weighted average of 28.4%. Similarly, the statistical analysis conducted on geographies consisting of 328,640,714 people shows a slight negative correlation between the proportion of Immigrants from Peru and percentage of family households with children in the United States with a correlation coefficient (R) of -0.068 and weighted average of 28.9%, a difference of 1.7%.
Family Households with Children Correlation Summary
| Measurement | Nigerian | Immigrants from Peru |
| Minimum | 14.3% | 9.0% |
| Maximum | 46.4% | 52.9% |
| Range | 32.1% | 44.0% |
| Mean | 28.1% | 28.8% |
| Median | 27.9% | 29.5% |
| Interquartile 25% (IQ1) | 26.5% | 25.8% |
| Interquartile 75% (IQ3) | 30.6% | 32.0% |
| Interquartile Range (IQR) | 4.1% | 6.2% |
| Standard Deviation (Sample) | 5.2% | 7.5% |
| Standard Deviation (Population) | 5.2% | 7.4% |
Similar Demographics by Family Households with Children
Demographics Similar to Nigerians by Family Households with Children
In terms of family households with children, the demographic groups most similar to Nigerians are Immigrants from Nepal (28.4%, a difference of 0.040%), Immigrants from Sri Lanka (28.4%, a difference of 0.050%), Immigrants from Jordan (28.4%, a difference of 0.060%), Immigrants from Iraq (28.4%, a difference of 0.070%), and Native/Alaskan (28.4%, a difference of 0.080%).
| Demographics | Rating | Rank | Family Households with Children |
| Immigrants | Honduras | 99.9 /100 | #70 | Exceptional 28.5% |
| Burmese | 99.9 /100 | #71 | Exceptional 28.5% |
| Immigrants | Indonesia | 99.9 /100 | #72 | Exceptional 28.5% |
| Iraqis | 99.9 /100 | #73 | Exceptional 28.5% |
| Laotians | 99.9 /100 | #74 | Exceptional 28.5% |
| Immigrants | Jordan | 99.9 /100 | #75 | Exceptional 28.4% |
| Immigrants | Sri Lanka | 99.9 /100 | #76 | Exceptional 28.4% |
| Nigerians | 99.8 /100 | #77 | Exceptional 28.4% |
| Immigrants | Nepal | 99.8 /100 | #78 | Exceptional 28.4% |
| Immigrants | Iraq | 99.8 /100 | #79 | Exceptional 28.4% |
| Natives/Alaskans | 99.8 /100 | #80 | Exceptional 28.4% |
| South Americans | 99.8 /100 | #81 | Exceptional 28.4% |
| Kenyans | 99.8 /100 | #82 | Exceptional 28.4% |
| Nicaraguans | 99.8 /100 | #83 | Exceptional 28.4% |
| Costa Ricans | 99.8 /100 | #84 | Exceptional 28.4% |
Demographics Similar to Immigrants from Peru by Family Households with Children
In terms of family households with children, the demographic groups most similar to Immigrants from Peru are Immigrants (28.9%, a difference of 0.040%), Guatemalan (28.9%, a difference of 0.080%), Jordanian (29.0%, a difference of 0.14%), Immigrants from Cambodia (28.9%, a difference of 0.15%), and Apache (29.0%, a difference of 0.23%).
| Demographics | Rating | Rank | Family Households with Children |
| Immigrants | Taiwan | 100.0 /100 | #44 | Exceptional 29.0% |
| Fijians | 100.0 /100 | #45 | Exceptional 29.0% |
| Immigrants | Philippines | 100.0 /100 | #46 | Exceptional 29.0% |
| Peruvians | 100.0 /100 | #47 | Exceptional 29.0% |
| Apache | 100.0 /100 | #48 | Exceptional 29.0% |
| Jordanians | 100.0 /100 | #49 | Exceptional 29.0% |
| Immigrants | Immigrants | 100.0 /100 | #50 | Exceptional 28.9% |
| Immigrants | Peru | 100.0 /100 | #51 | Exceptional 28.9% |
| Guatemalans | 100.0 /100 | #52 | Exceptional 28.9% |
| Immigrants | Cambodia | 100.0 /100 | #53 | Exceptional 28.9% |
| Sierra Leoneans | 100.0 /100 | #54 | Exceptional 28.9% |
| Immigrants | Asia | 100.0 /100 | #55 | Exceptional 28.8% |
| Immigrants | Guatemala | 100.0 /100 | #56 | Exceptional 28.8% |
| Danes | 100.0 /100 | #57 | Exceptional 28.7% |
| Hawaiians | 100.0 /100 | #58 | Exceptional 28.7% |