Assyrian/Chaldean/Syriac vs Colombian Married-couple Households
COMPARE
Assyrian/Chaldean/Syriac
Colombian
Married-couple Households
Married-couple Households Comparison
Assyrians/Chaldeans/Syriacs
Colombians
51.8%
MARRIED-COUPLE HOUSEHOLDS
100.0/ 100
METRIC RATING
4th/ 347
METRIC RANK
46.8%
MARRIED-COUPLE HOUSEHOLDS
71.0/ 100
METRIC RATING
162nd/ 347
METRIC RANK
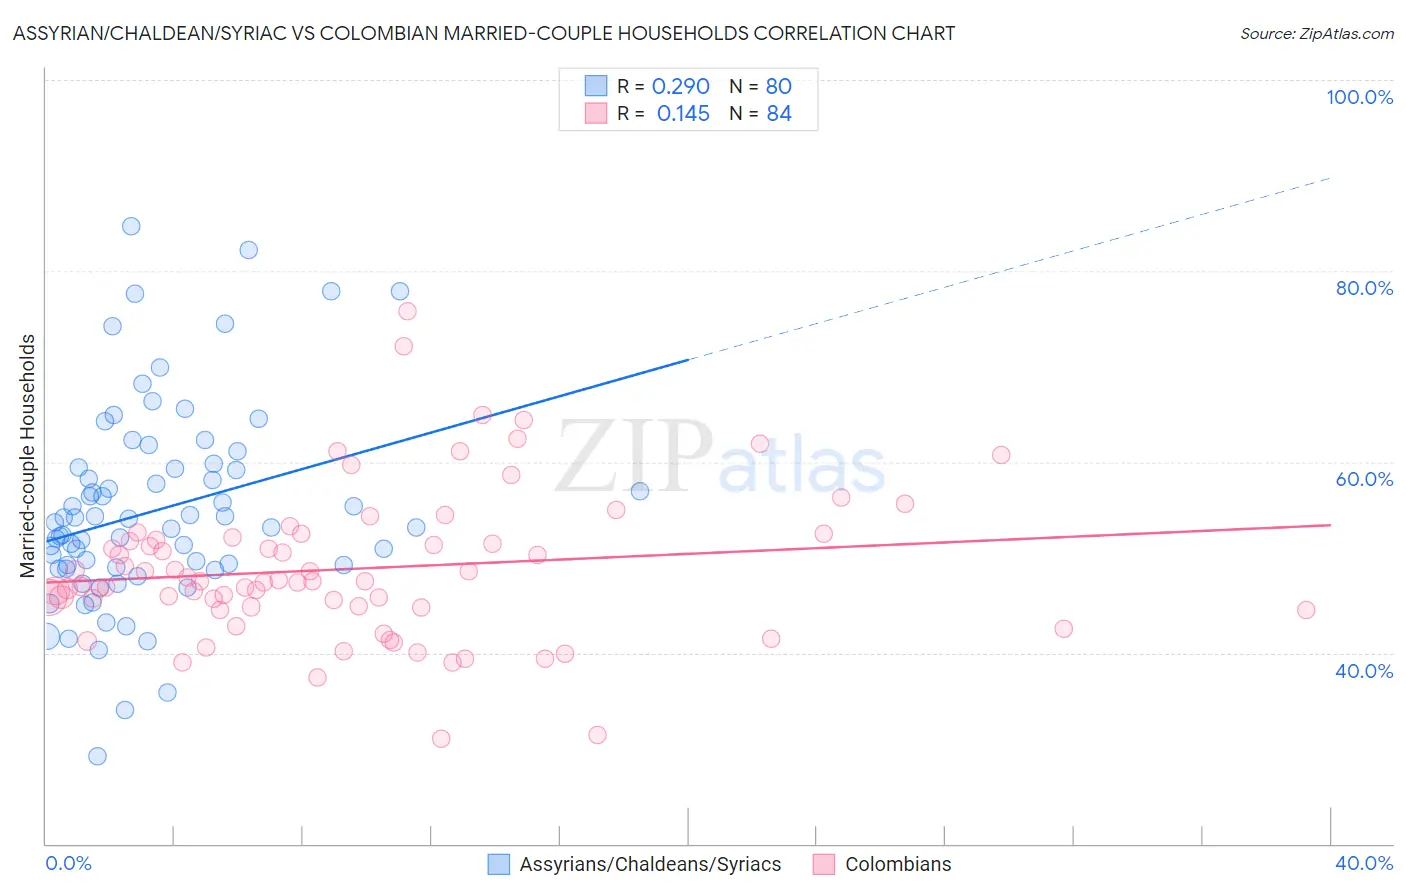
Assyrian/Chaldean/Syriac vs Colombian Married-couple Households Correlation Chart
The statistical analysis conducted on geographies consisting of 110,294,582 people shows a weak positive correlation between the proportion of Assyrians/Chaldeans/Syriacs and percentage of married-couple family households in the United States with a correlation coefficient (R) of 0.290 and weighted average of 51.8%. Similarly, the statistical analysis conducted on geographies consisting of 419,302,145 people shows a poor positive correlation between the proportion of Colombians and percentage of married-couple family households in the United States with a correlation coefficient (R) of 0.145 and weighted average of 46.8%, a difference of 10.6%.
Married-couple Households Correlation Summary
| Measurement | Assyrian/Chaldean/Syriac | Colombian |
| Minimum | 29.2% | 31.0% |
| Maximum | 84.7% | 75.7% |
| Range | 55.5% | 44.7% |
| Mean | 54.9% | 48.8% |
| Median | 53.4% | 47.5% |
| Interquartile 25% (IQ1) | 48.9% | 44.8% |
| Interquartile 75% (IQ3) | 59.3% | 51.9% |
| Interquartile Range (IQR) | 10.4% | 7.1% |
| Standard Deviation (Sample) | 10.5% | 7.8% |
| Standard Deviation (Population) | 10.4% | 7.8% |
Similar Demographics by Married-couple Households
Demographics Similar to Assyrians/Chaldeans/Syriacs by Married-couple Households
In terms of married-couple households, the demographic groups most similar to Assyrians/Chaldeans/Syriacs are Thai (51.9%, a difference of 0.21%), Tongan (51.6%, a difference of 0.48%), Immigrants from Taiwan (52.4%, a difference of 1.2%), Danish (51.1%, a difference of 1.5%), and Filipino (51.0%, a difference of 1.7%).
| Demographics | Rating | Rank | Married-couple Households |
| Immigrants | India | 100.0 /100 | #1 | Exceptional 52.7% |
| Immigrants | Taiwan | 100.0 /100 | #2 | Exceptional 52.4% |
| Thais | 100.0 /100 | #3 | Exceptional 51.9% |
| Assyrians/Chaldeans/Syriacs | 100.0 /100 | #4 | Exceptional 51.8% |
| Tongans | 100.0 /100 | #5 | Exceptional 51.6% |
| Danes | 100.0 /100 | #6 | Exceptional 51.1% |
| Filipinos | 100.0 /100 | #7 | Exceptional 51.0% |
| Immigrants | South Central Asia | 100.0 /100 | #8 | Exceptional 50.6% |
| Pennsylvania Germans | 100.0 /100 | #9 | Exceptional 50.4% |
| Chinese | 100.0 /100 | #10 | Exceptional 50.4% |
| Immigrants | Pakistan | 100.0 /100 | #11 | Exceptional 50.1% |
| Swiss | 100.0 /100 | #12 | Exceptional 49.9% |
| Immigrants | Korea | 100.0 /100 | #13 | Exceptional 49.9% |
| Burmese | 100.0 /100 | #14 | Exceptional 49.8% |
| Koreans | 99.9 /100 | #15 | Exceptional 49.7% |
Demographics Similar to Colombians by Married-couple Households
In terms of married-couple households, the demographic groups most similar to Colombians are Delaware (46.8%, a difference of 0.010%), Iraqi (46.9%, a difference of 0.030%), Immigrants from Turkey (46.8%, a difference of 0.040%), Immigrants from Kazakhstan (46.8%, a difference of 0.050%), and Immigrants from Southern Europe (46.8%, a difference of 0.050%).
| Demographics | Rating | Rank | Married-couple Households |
| Arabs | 76.0 /100 | #155 | Good 46.9% |
| Armenians | 75.4 /100 | #156 | Good 46.9% |
| Immigrants | Oceania | 74.8 /100 | #157 | Good 46.9% |
| Immigrants | Nonimmigrants | 73.3 /100 | #158 | Good 46.9% |
| Osage | 73.2 /100 | #159 | Good 46.9% |
| Iraqis | 71.7 /100 | #160 | Good 46.9% |
| Delaware | 71.2 /100 | #161 | Good 46.8% |
| Colombians | 71.0 /100 | #162 | Good 46.8% |
| Immigrants | Turkey | 70.2 /100 | #163 | Good 46.8% |
| Immigrants | Kazakhstan | 70.0 /100 | #164 | Good 46.8% |
| Immigrants | Southern Europe | 69.9 /100 | #165 | Good 46.8% |
| Cherokee | 65.7 /100 | #166 | Good 46.7% |
| Immigrants | Croatia | 64.2 /100 | #167 | Good 46.7% |
| Israelis | 62.3 /100 | #168 | Good 46.7% |
| Spanish American Indians | 59.4 /100 | #169 | Average 46.6% |