Immigrants from Dominica vs Immigrants from Moldova Single Father Households
COMPARE
Immigrants from Dominica
Immigrants from Moldova
Single Father Households
Single Father Households Comparison
Immigrants from Dominica
Immigrants from Moldova
2.5%
SINGLE FATHER HOUSEHOLDS
4.8/ 100
METRIC RATING
240th/ 347
METRIC RANK
2.1%
SINGLE FATHER HOUSEHOLDS
99.1/ 100
METRIC RATING
97th/ 347
METRIC RANK
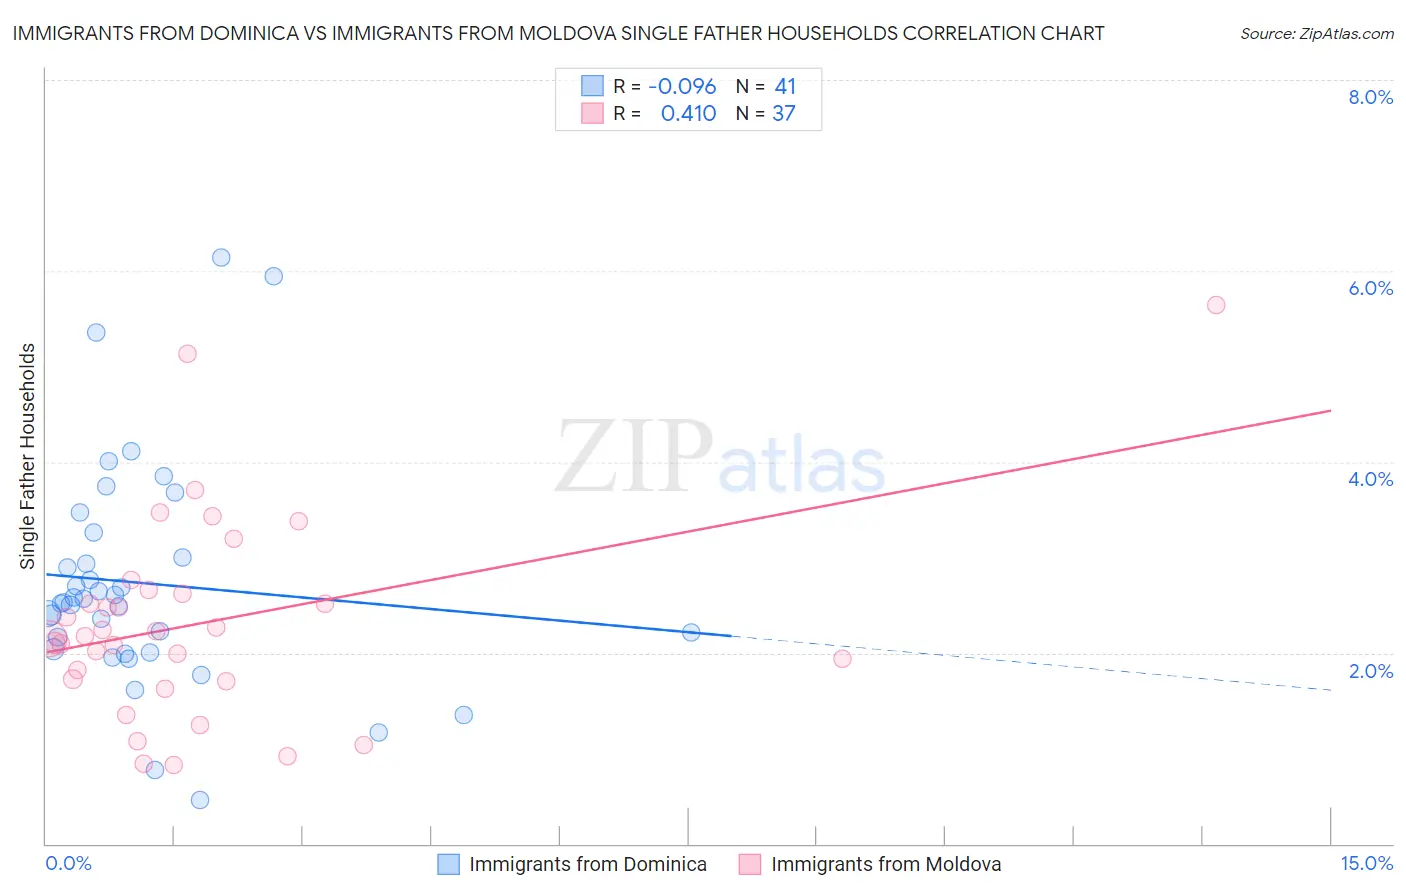
Immigrants from Dominica vs Immigrants from Moldova Single Father Households Correlation Chart
The statistical analysis conducted on geographies consisting of 83,648,183 people shows a slight negative correlation between the proportion of Immigrants from Dominica and percentage of single father households in the United States with a correlation coefficient (R) of -0.096 and weighted average of 2.5%. Similarly, the statistical analysis conducted on geographies consisting of 124,176,344 people shows a moderate positive correlation between the proportion of Immigrants from Moldova and percentage of single father households in the United States with a correlation coefficient (R) of 0.410 and weighted average of 2.1%, a difference of 15.6%.
Single Father Households Correlation Summary
| Measurement | Immigrants from Dominica | Immigrants from Moldova |
| Minimum | 0.46% | 0.82% |
| Maximum | 6.1% | 5.6% |
| Range | 5.7% | 4.8% |
| Mean | 2.7% | 2.3% |
| Median | 2.5% | 2.2% |
| Interquartile 25% (IQ1) | 2.0% | 1.7% |
| Interquartile 75% (IQ3) | 3.1% | 2.6% |
| Interquartile Range (IQR) | 1.1% | 0.92% |
| Standard Deviation (Sample) | 1.2% | 1.0% |
| Standard Deviation (Population) | 1.2% | 1.0% |
Similar Demographics by Single Father Households
Demographics Similar to Immigrants from Dominica by Single Father Households
In terms of single father households, the demographic groups most similar to Immigrants from Dominica are Portuguese (2.5%, a difference of 0.26%), Osage (2.5%, a difference of 0.29%), Immigrants from Oceania (2.5%, a difference of 0.36%), Immigrants from Sierra Leone (2.5%, a difference of 0.37%), and Sierra Leonean (2.5%, a difference of 0.41%).
| Demographics | Rating | Rank | Single Father Households |
| Immigrants | Western Africa | 7.0 /100 | #233 | Tragic 2.4% |
| Africans | 6.3 /100 | #234 | Tragic 2.5% |
| Immigrants | Immigrants | 6.3 /100 | #235 | Tragic 2.5% |
| Cajuns | 6.1 /100 | #236 | Tragic 2.5% |
| Sierra Leoneans | 5.9 /100 | #237 | Tragic 2.5% |
| Immigrants | Sierra Leone | 5.8 /100 | #238 | Tragic 2.5% |
| Immigrants | Oceania | 5.8 /100 | #239 | Tragic 2.5% |
| Immigrants | Dominica | 4.8 /100 | #240 | Tragic 2.5% |
| Portuguese | 4.1 /100 | #241 | Tragic 2.5% |
| Osage | 4.1 /100 | #242 | Tragic 2.5% |
| Spaniards | 3.1 /100 | #243 | Tragic 2.5% |
| Immigrants | Middle Africa | 2.8 /100 | #244 | Tragic 2.5% |
| Basques | 2.5 /100 | #245 | Tragic 2.5% |
| Native Hawaiians | 2.5 /100 | #246 | Tragic 2.5% |
| Delaware | 2.5 /100 | #247 | Tragic 2.5% |
Demographics Similar to Immigrants from Moldova by Single Father Households
In terms of single father households, the demographic groups most similar to Immigrants from Moldova are Arab (2.1%, a difference of 0.13%), Guyanese (2.1%, a difference of 0.13%), South African (2.1%, a difference of 0.17%), Bermudan (2.1%, a difference of 0.27%), and Immigrants from Northern Africa (2.1%, a difference of 0.32%).
| Demographics | Rating | Rank | Single Father Households |
| Immigrants | Pakistan | 99.5 /100 | #90 | Exceptional 2.1% |
| Immigrants | Guyana | 99.4 /100 | #91 | Exceptional 2.1% |
| Romanians | 99.4 /100 | #92 | Exceptional 2.1% |
| Croatians | 99.3 /100 | #93 | Exceptional 2.1% |
| Ukrainians | 99.3 /100 | #94 | Exceptional 2.1% |
| Bermudans | 99.2 /100 | #95 | Exceptional 2.1% |
| Arabs | 99.2 /100 | #96 | Exceptional 2.1% |
| Immigrants | Moldova | 99.1 /100 | #97 | Exceptional 2.1% |
| Guyanese | 99.1 /100 | #98 | Exceptional 2.1% |
| South Africans | 99.1 /100 | #99 | Exceptional 2.1% |
| Immigrants | Northern Africa | 99.0 /100 | #100 | Exceptional 2.1% |
| Immigrants | Western Europe | 98.9 /100 | #101 | Exceptional 2.1% |
| Argentineans | 98.9 /100 | #102 | Exceptional 2.1% |
| Lebanese | 98.9 /100 | #103 | Exceptional 2.1% |
| Alsatians | 98.9 /100 | #104 | Exceptional 2.1% |