Samoan vs Immigrants from Moldova Single Father Households
COMPARE
Samoan
Immigrants from Moldova
Single Father Households
Single Father Households Comparison
Samoans
Immigrants from Moldova
2.6%
SINGLE FATHER HOUSEHOLDS
0.1/ 100
METRIC RATING
279th/ 347
METRIC RANK
2.1%
SINGLE FATHER HOUSEHOLDS
99.1/ 100
METRIC RATING
97th/ 347
METRIC RANK
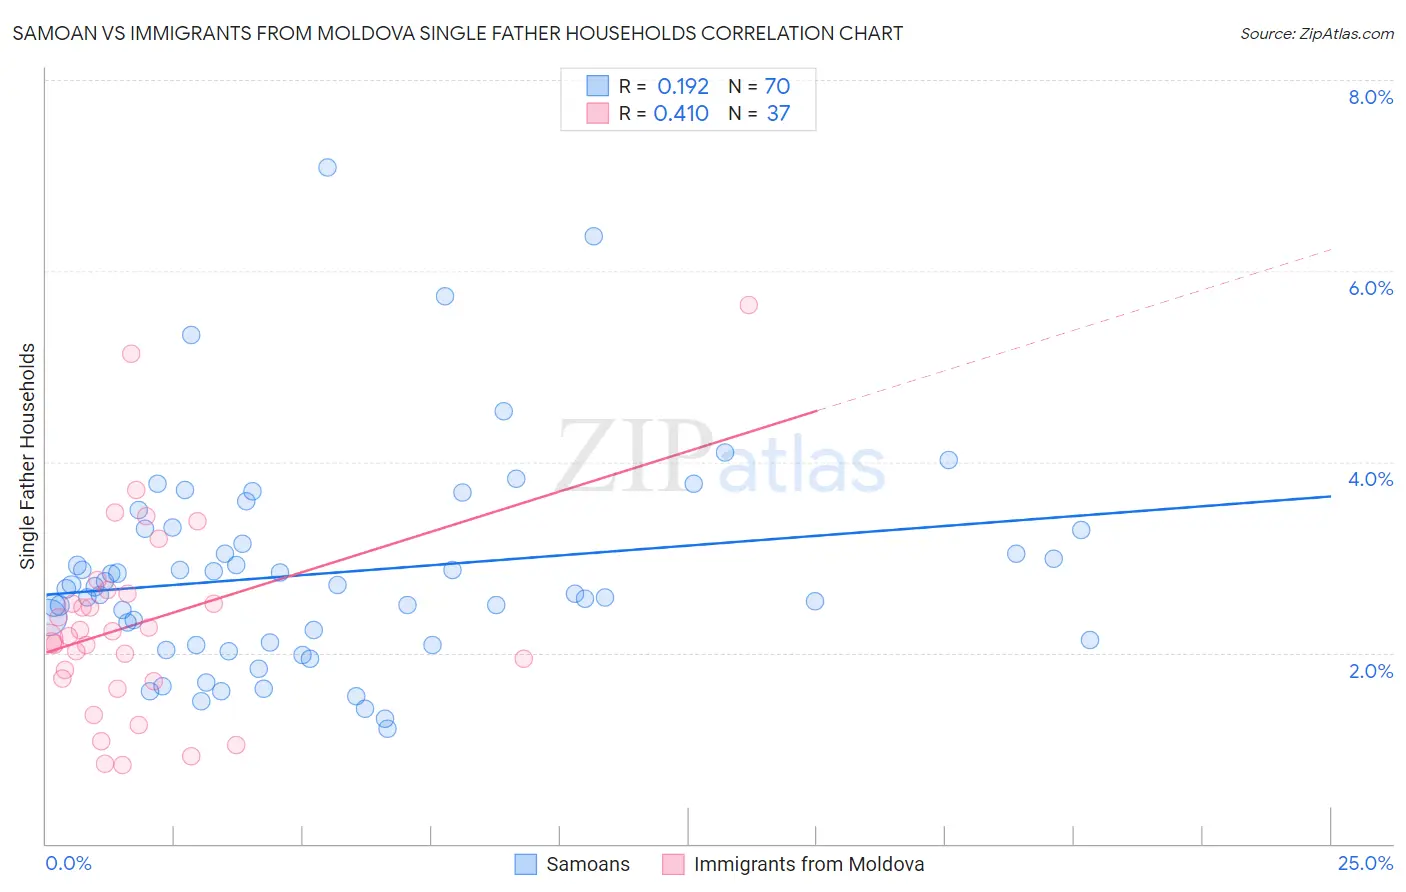
Samoan vs Immigrants from Moldova Single Father Households Correlation Chart
The statistical analysis conducted on geographies consisting of 224,300,903 people shows a poor positive correlation between the proportion of Samoans and percentage of single father households in the United States with a correlation coefficient (R) of 0.192 and weighted average of 2.6%. Similarly, the statistical analysis conducted on geographies consisting of 124,176,344 people shows a moderate positive correlation between the proportion of Immigrants from Moldova and percentage of single father households in the United States with a correlation coefficient (R) of 0.410 and weighted average of 2.1%, a difference of 22.9%.
Single Father Households Correlation Summary
| Measurement | Samoan | Immigrants from Moldova |
| Minimum | 1.2% | 0.82% |
| Maximum | 7.1% | 5.6% |
| Range | 5.9% | 4.8% |
| Mean | 2.8% | 2.3% |
| Median | 2.7% | 2.2% |
| Interquartile 25% (IQ1) | 2.1% | 1.7% |
| Interquartile 75% (IQ3) | 3.3% | 2.6% |
| Interquartile Range (IQR) | 1.2% | 0.92% |
| Standard Deviation (Sample) | 1.1% | 1.0% |
| Standard Deviation (Population) | 1.1% | 1.0% |
Similar Demographics by Single Father Households
Demographics Similar to Samoans by Single Father Households
In terms of single father households, the demographic groups most similar to Samoans are Cherokee (2.6%, a difference of 0.040%), Shoshone (2.6%, a difference of 0.090%), Immigrants from Haiti (2.6%, a difference of 0.12%), Immigrants from Dominican Republic (2.6%, a difference of 0.33%), and Immigrants from Portugal (2.6%, a difference of 0.55%).
| Demographics | Rating | Rank | Single Father Households |
| Belizeans | 0.2 /100 | #272 | Tragic 2.6% |
| Iroquois | 0.2 /100 | #273 | Tragic 2.6% |
| Puerto Ricans | 0.2 /100 | #274 | Tragic 2.6% |
| Immigrants | Dominican Republic | 0.2 /100 | #275 | Tragic 2.6% |
| Immigrants | Haiti | 0.1 /100 | #276 | Tragic 2.6% |
| Shoshone | 0.1 /100 | #277 | Tragic 2.6% |
| Cherokee | 0.1 /100 | #278 | Tragic 2.6% |
| Samoans | 0.1 /100 | #279 | Tragic 2.6% |
| Immigrants | Portugal | 0.1 /100 | #280 | Tragic 2.6% |
| Nicaraguans | 0.1 /100 | #281 | Tragic 2.6% |
| Dutch West Indians | 0.1 /100 | #282 | Tragic 2.6% |
| Immigrants | Nicaragua | 0.1 /100 | #283 | Tragic 2.7% |
| Hawaiians | 0.1 /100 | #284 | Tragic 2.7% |
| Ottawa | 0.1 /100 | #285 | Tragic 2.7% |
| Immigrants | Cuba | 0.1 /100 | #286 | Tragic 2.7% |
Demographics Similar to Immigrants from Moldova by Single Father Households
In terms of single father households, the demographic groups most similar to Immigrants from Moldova are Arab (2.1%, a difference of 0.13%), Guyanese (2.1%, a difference of 0.13%), South African (2.1%, a difference of 0.17%), Bermudan (2.1%, a difference of 0.27%), and Immigrants from Northern Africa (2.1%, a difference of 0.32%).
| Demographics | Rating | Rank | Single Father Households |
| Immigrants | Pakistan | 99.5 /100 | #90 | Exceptional 2.1% |
| Immigrants | Guyana | 99.4 /100 | #91 | Exceptional 2.1% |
| Romanians | 99.4 /100 | #92 | Exceptional 2.1% |
| Croatians | 99.3 /100 | #93 | Exceptional 2.1% |
| Ukrainians | 99.3 /100 | #94 | Exceptional 2.1% |
| Bermudans | 99.2 /100 | #95 | Exceptional 2.1% |
| Arabs | 99.2 /100 | #96 | Exceptional 2.1% |
| Immigrants | Moldova | 99.1 /100 | #97 | Exceptional 2.1% |
| Guyanese | 99.1 /100 | #98 | Exceptional 2.1% |
| South Africans | 99.1 /100 | #99 | Exceptional 2.1% |
| Immigrants | Northern Africa | 99.0 /100 | #100 | Exceptional 2.1% |
| Immigrants | Western Europe | 98.9 /100 | #101 | Exceptional 2.1% |
| Argentineans | 98.9 /100 | #102 | Exceptional 2.1% |
| Lebanese | 98.9 /100 | #103 | Exceptional 2.1% |
| Alsatians | 98.9 /100 | #104 | Exceptional 2.1% |