Asian vs Tohono O'odham Single Father Households
COMPARE
Asian
Tohono O'odham
Single Father Households
Single Father Households Comparison
Asians
Tohono O'odham
2.1%
SINGLE FATHER HOUSEHOLDS
99.6/ 100
METRIC RATING
86th/ 347
METRIC RANK
3.8%
SINGLE FATHER HOUSEHOLDS
0.0/ 100
METRIC RATING
342nd/ 347
METRIC RANK
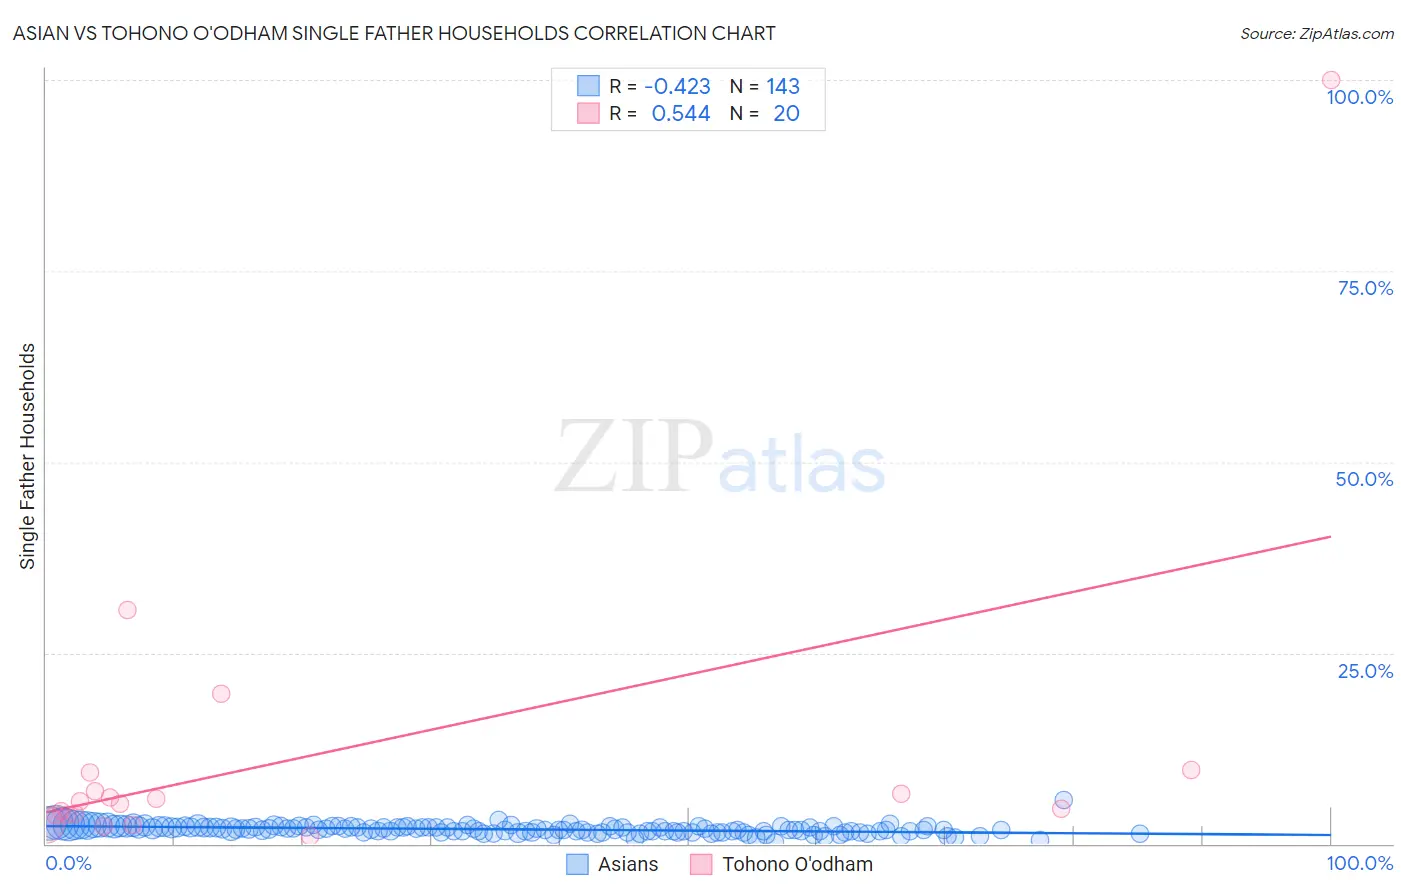
Asian vs Tohono O'odham Single Father Households Correlation Chart
The statistical analysis conducted on geographies consisting of 539,811,945 people shows a moderate negative correlation between the proportion of Asians and percentage of single father households in the United States with a correlation coefficient (R) of -0.423 and weighted average of 2.1%. Similarly, the statistical analysis conducted on geographies consisting of 58,632,927 people shows a substantial positive correlation between the proportion of Tohono O'odham and percentage of single father households in the United States with a correlation coefficient (R) of 0.544 and weighted average of 3.8%, a difference of 82.1%.
Single Father Households Correlation Summary
| Measurement | Asian | Tohono O'odham |
| Minimum | 0.19% | 1.0% |
| Maximum | 5.7% | 100.0% |
| Range | 5.5% | 99.0% |
| Mean | 1.9% | 11.7% |
| Median | 1.9% | 5.4% |
| Interquartile 25% (IQ1) | 1.6% | 3.8% |
| Interquartile 75% (IQ3) | 2.2% | 8.1% |
| Interquartile Range (IQR) | 0.67% | 4.3% |
| Standard Deviation (Sample) | 0.58% | 21.9% |
| Standard Deviation (Population) | 0.58% | 21.3% |
Similar Demographics by Single Father Households
Demographics Similar to Asians by Single Father Households
In terms of single father households, the demographic groups most similar to Asians are Immigrants from Hungary (2.1%, a difference of 0.080%), Carpatho Rusyn (2.1%, a difference of 0.12%), Greek (2.1%, a difference of 0.42%), New Zealander (2.1%, a difference of 0.43%), and Armenian (2.1%, a difference of 0.48%).
| Demographics | Rating | Rank | Single Father Households |
| Immigrants | Asia | 99.7 /100 | #79 | Exceptional 2.1% |
| Immigrants | South Africa | 99.7 /100 | #80 | Exceptional 2.1% |
| Armenians | 99.7 /100 | #81 | Exceptional 2.1% |
| New Zealanders | 99.7 /100 | #82 | Exceptional 2.1% |
| Greeks | 99.7 /100 | #83 | Exceptional 2.1% |
| Carpatho Rusyns | 99.6 /100 | #84 | Exceptional 2.1% |
| Immigrants | Hungary | 99.6 /100 | #85 | Exceptional 2.1% |
| Asians | 99.6 /100 | #86 | Exceptional 2.1% |
| Lithuanians | 99.5 /100 | #87 | Exceptional 2.1% |
| Bhutanese | 99.5 /100 | #88 | Exceptional 2.1% |
| Immigrants | Armenia | 99.5 /100 | #89 | Exceptional 2.1% |
| Immigrants | Pakistan | 99.5 /100 | #90 | Exceptional 2.1% |
| Immigrants | Guyana | 99.4 /100 | #91 | Exceptional 2.1% |
| Romanians | 99.4 /100 | #92 | Exceptional 2.1% |
| Croatians | 99.3 /100 | #93 | Exceptional 2.1% |
Demographics Similar to Tohono O'odham by Single Father Households
In terms of single father households, the demographic groups most similar to Tohono O'odham are Crow (3.5%, a difference of 8.8%), Alaska Native (3.5%, a difference of 9.1%), Pima (4.2%, a difference of 9.2%), Yakama (4.2%, a difference of 9.5%), and Menominee (4.2%, a difference of 10.2%).
| Demographics | Rating | Rank | Single Father Households |
| Natives/Alaskans | 0.0 /100 | #333 | Tragic 3.2% |
| Yuman | 0.0 /100 | #334 | Tragic 3.3% |
| Colville | 0.0 /100 | #335 | Tragic 3.3% |
| Paiute | 0.0 /100 | #336 | Tragic 3.3% |
| Pueblo | 0.0 /100 | #337 | Tragic 3.3% |
| Sioux | 0.0 /100 | #338 | Tragic 3.3% |
| Alaskan Athabascans | 0.0 /100 | #339 | Tragic 3.4% |
| Alaska Natives | 0.0 /100 | #340 | Tragic 3.5% |
| Crow | 0.0 /100 | #341 | Tragic 3.5% |
| Tohono O'odham | 0.0 /100 | #342 | Tragic 3.8% |
| Pima | 0.0 /100 | #343 | Tragic 4.2% |
| Yakama | 0.0 /100 | #344 | Tragic 4.2% |
| Menominee | 0.0 /100 | #345 | Tragic 4.2% |
| Inupiat | 0.0 /100 | #346 | Tragic 4.9% |
| Yup'ik | 0.0 /100 | #347 | Tragic 5.4% |