Armenian vs Bahamian Single Mother Households
COMPARE
Armenian
Bahamian
Single Mother Households
Single Mother Households Comparison
Armenians
Bahamians
5.2%
SINGLE MOTHER HOUSEHOLDS
99.8/ 100
METRIC RATING
24th/ 347
METRIC RANK
8.3%
SINGLE MOTHER HOUSEHOLDS
0.0/ 100
METRIC RATING
320th/ 347
METRIC RANK
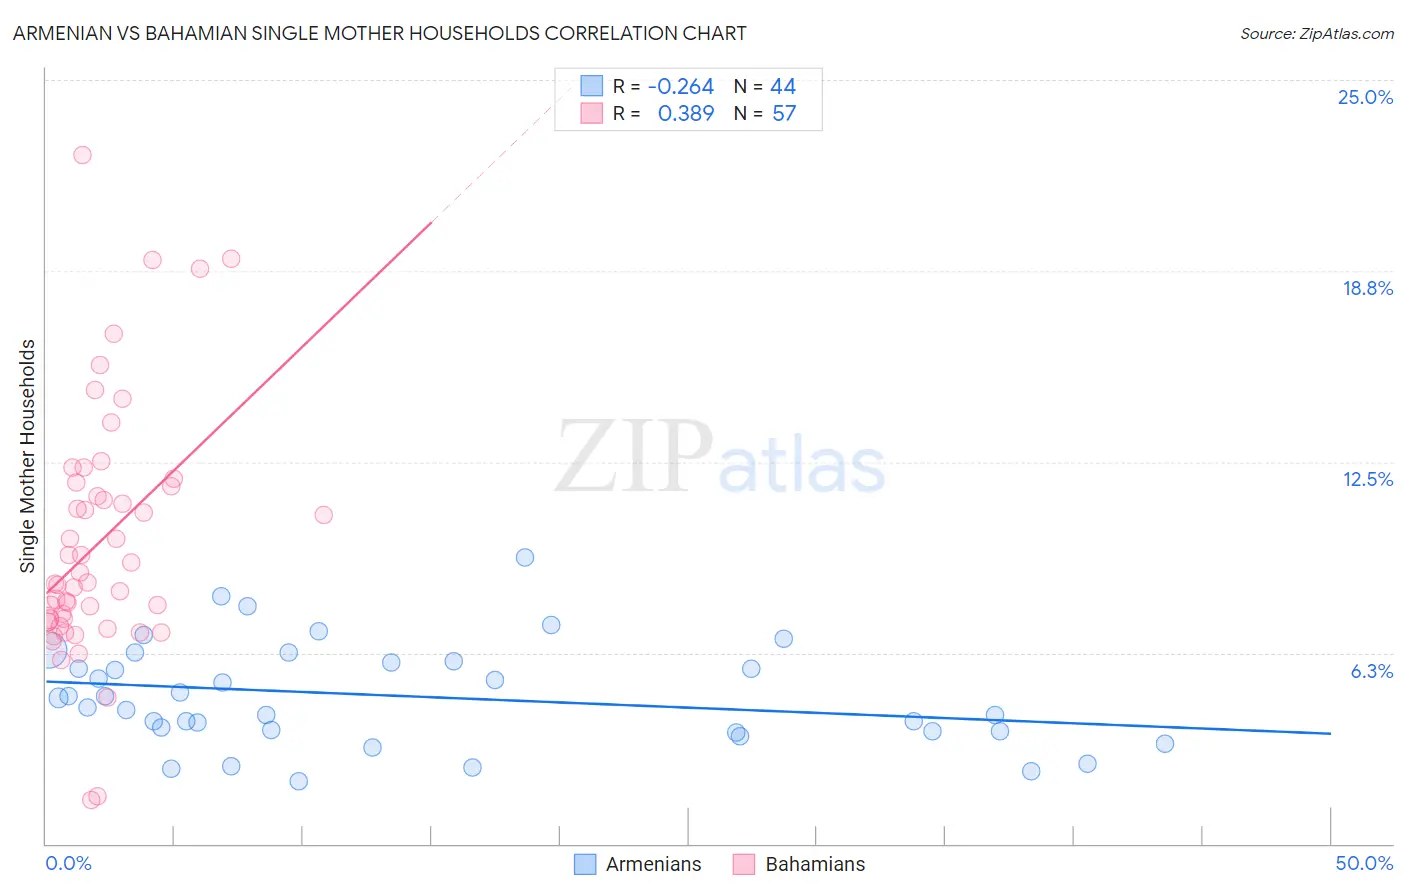
Armenian vs Bahamian Single Mother Households Correlation Chart
The statistical analysis conducted on geographies consisting of 310,071,086 people shows a weak negative correlation between the proportion of Armenians and percentage of single mother households in the United States with a correlation coefficient (R) of -0.264 and weighted average of 5.2%. Similarly, the statistical analysis conducted on geographies consisting of 112,454,075 people shows a mild positive correlation between the proportion of Bahamians and percentage of single mother households in the United States with a correlation coefficient (R) of 0.389 and weighted average of 8.3%, a difference of 57.7%.
Single Mother Households Correlation Summary
| Measurement | Armenian | Bahamian |
| Minimum | 2.1% | 1.4% |
| Maximum | 9.4% | 22.6% |
| Range | 7.3% | 21.1% |
| Mean | 4.8% | 9.9% |
| Median | 4.6% | 8.5% |
| Interquartile 25% (IQ1) | 3.7% | 7.3% |
| Interquartile 75% (IQ3) | 5.9% | 11.8% |
| Interquartile Range (IQR) | 2.3% | 4.5% |
| Standard Deviation (Sample) | 1.7% | 4.1% |
| Standard Deviation (Population) | 1.7% | 4.0% |
Similar Demographics by Single Mother Households
Demographics Similar to Armenians by Single Mother Households
In terms of single mother households, the demographic groups most similar to Armenians are Immigrants from Austria (5.2%, a difference of 0.060%), Thai (5.2%, a difference of 0.11%), Immigrants from Japan (5.2%, a difference of 0.34%), Immigrants from Lithuania (5.3%, a difference of 0.36%), and Eastern European (5.2%, a difference of 0.83%).
| Demographics | Rating | Rank | Single Mother Households |
| Soviet Union | 99.9 /100 | #17 | Exceptional 5.1% |
| Immigrants | Armenia | 99.9 /100 | #18 | Exceptional 5.2% |
| Chinese | 99.9 /100 | #19 | Exceptional 5.2% |
| Maltese | 99.9 /100 | #20 | Exceptional 5.2% |
| Eastern Europeans | 99.8 /100 | #21 | Exceptional 5.2% |
| Thais | 99.8 /100 | #22 | Exceptional 5.2% |
| Immigrants | Austria | 99.8 /100 | #23 | Exceptional 5.2% |
| Armenians | 99.8 /100 | #24 | Exceptional 5.2% |
| Immigrants | Japan | 99.8 /100 | #25 | Exceptional 5.2% |
| Immigrants | Lithuania | 99.8 /100 | #26 | Exceptional 5.3% |
| Bhutanese | 99.7 /100 | #27 | Exceptional 5.3% |
| Russians | 99.7 /100 | #28 | Exceptional 5.3% |
| Latvians | 99.7 /100 | #29 | Exceptional 5.3% |
| Burmese | 99.7 /100 | #30 | Exceptional 5.3% |
| Immigrants | Korea | 99.7 /100 | #31 | Exceptional 5.3% |
Demographics Similar to Bahamians by Single Mother Households
In terms of single mother households, the demographic groups most similar to Bahamians are Jamaican (8.2%, a difference of 0.12%), Senegalese (8.2%, a difference of 0.23%), Immigrants from Senegal (8.3%, a difference of 0.24%), Pima (8.3%, a difference of 0.32%), and Immigrants from Honduras (8.2%, a difference of 0.80%).
| Demographics | Rating | Rank | Single Mother Households |
| Immigrants | Grenada | 0.0 /100 | #313 | Tragic 8.2% |
| Immigrants | Mexico | 0.0 /100 | #314 | Tragic 8.2% |
| Immigrants | Western Africa | 0.0 /100 | #315 | Tragic 8.2% |
| Africans | 0.0 /100 | #316 | Tragic 8.2% |
| Immigrants | Honduras | 0.0 /100 | #317 | Tragic 8.2% |
| Senegalese | 0.0 /100 | #318 | Tragic 8.2% |
| Jamaicans | 0.0 /100 | #319 | Tragic 8.2% |
| Bahamians | 0.0 /100 | #320 | Tragic 8.3% |
| Immigrants | Senegal | 0.0 /100 | #321 | Tragic 8.3% |
| Pima | 0.0 /100 | #322 | Tragic 8.3% |
| Haitians | 0.0 /100 | #323 | Tragic 8.3% |
| Immigrants | Jamaica | 0.0 /100 | #324 | Tragic 8.4% |
| Immigrants | Caribbean | 0.0 /100 | #325 | Tragic 8.4% |
| British West Indians | 0.0 /100 | #326 | Tragic 8.4% |
| Immigrants | Haiti | 0.0 /100 | #327 | Tragic 8.4% |