Apache vs Colville Average Family Size
COMPARE
Apache
Colville
Average Family Size
Average Family Size Comparison
Apache
Colville
3.46
AVERAGE FAMILY SIZE
100.0/ 100
METRIC RATING
22nd/ 347
METRIC RANK
3.14
AVERAGE FAMILY SIZE
0.2/ 100
METRIC RATING
298th/ 347
METRIC RANK
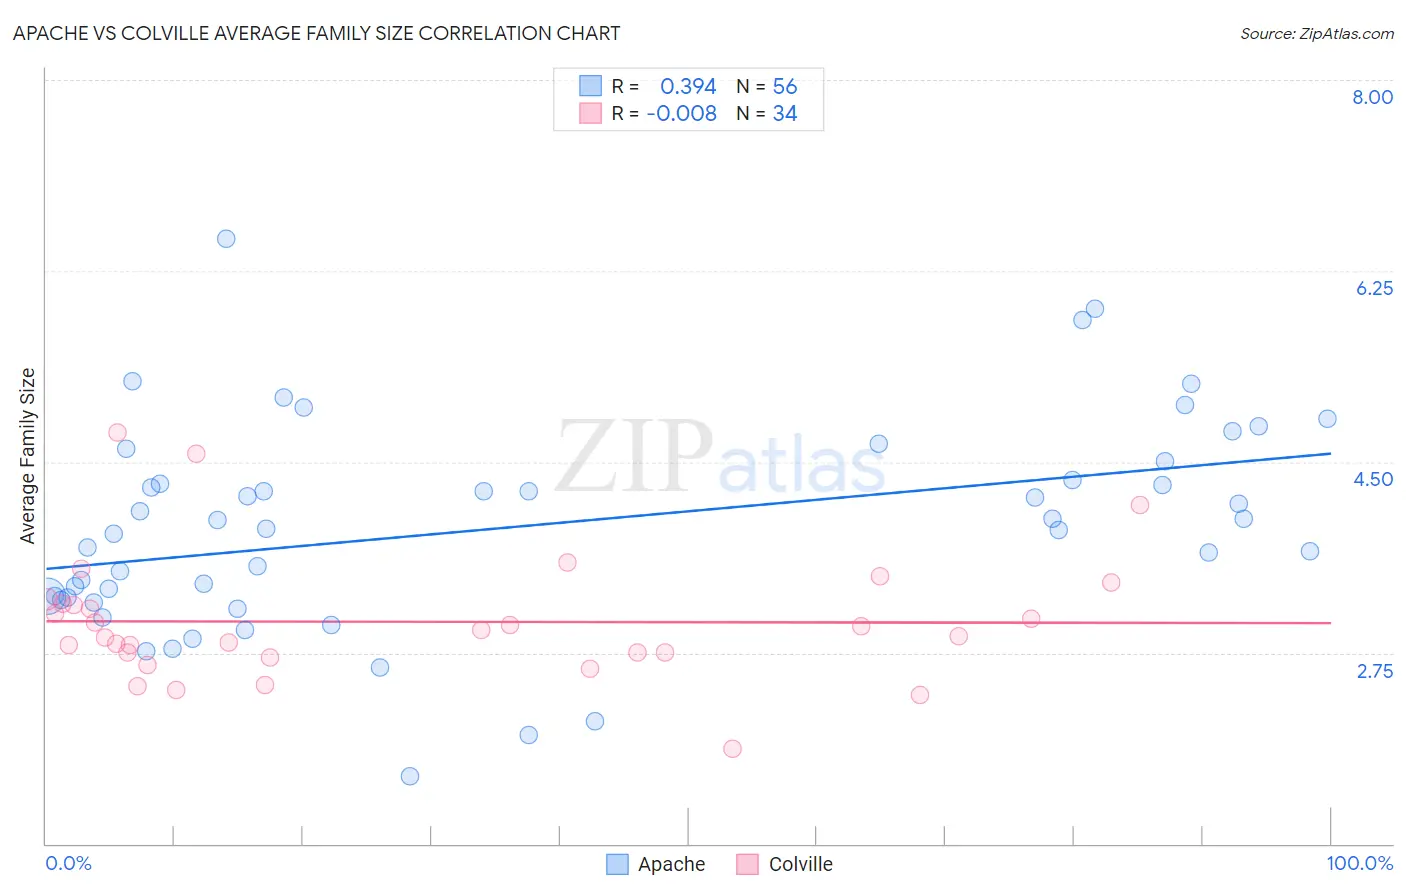
Apache vs Colville Average Family Size Correlation Chart
The statistical analysis conducted on geographies consisting of 231,040,944 people shows a mild positive correlation between the proportion of Apache and average family size in the United States with a correlation coefficient (R) of 0.394 and weighted average of 3.46. Similarly, the statistical analysis conducted on geographies consisting of 34,682,970 people shows no correlation between the proportion of Colville and average family size in the United States with a correlation coefficient (R) of -0.008 and weighted average of 3.14, a difference of 10.4%.
Average Family Size Correlation Summary
| Measurement | Apache | Colville |
| Minimum | 1.62 | 1.87 |
| Maximum | 6.54 | 4.77 |
| Range | 4.92 | 2.90 |
| Mean | 3.91 | 3.03 |
| Median | 3.93 | 2.93 |
| Interquartile 25% (IQ1) | 3.27 | 2.75 |
| Interquartile 75% (IQ3) | 4.42 | 3.20 |
| Interquartile Range (IQR) | 1.15 | 0.45 |
| Standard Deviation (Sample) | 0.96 | 0.58 |
| Standard Deviation (Population) | 0.96 | 0.58 |
Similar Demographics by Average Family Size
Demographics Similar to Apache by Average Family Size
In terms of average family size, the demographic groups most similar to Apache are Yuman (3.47, a difference of 0.060%), Immigrants from Fiji (3.45, a difference of 0.29%), Cheyenne (3.47, a difference of 0.31%), Mexican (3.48, a difference of 0.35%), and Native/Alaskan (3.45, a difference of 0.41%).
| Demographics | Rating | Rank | Average Family Size |
| Tongans | 100.0 /100 | #15 | Exceptional 3.49 |
| Ute | 100.0 /100 | #16 | Exceptional 3.49 |
| Immigrants | El Salvador | 100.0 /100 | #17 | Exceptional 3.49 |
| Salvadorans | 100.0 /100 | #18 | Exceptional 3.48 |
| Mexicans | 100.0 /100 | #19 | Exceptional 3.48 |
| Cheyenne | 100.0 /100 | #20 | Exceptional 3.47 |
| Yuman | 100.0 /100 | #21 | Exceptional 3.47 |
| Apache | 100.0 /100 | #22 | Exceptional 3.46 |
| Immigrants | Fiji | 100.0 /100 | #23 | Exceptional 3.45 |
| Natives/Alaskans | 100.0 /100 | #24 | Exceptional 3.45 |
| Yakama | 100.0 /100 | #25 | Exceptional 3.45 |
| Native Hawaiians | 100.0 /100 | #26 | Exceptional 3.43 |
| Mexican American Indians | 100.0 /100 | #27 | Exceptional 3.43 |
| Immigrants | Latin America | 100.0 /100 | #28 | Exceptional 3.42 |
| Nepalese | 100.0 /100 | #29 | Exceptional 3.42 |
Demographics Similar to Colville by Average Family Size
In terms of average family size, the demographic groups most similar to Colville are Immigrants from Western Europe (3.14, a difference of 0.0%), Immigrants from Croatia (3.14, a difference of 0.010%), Austrian (3.14, a difference of 0.010%), Ukrainian (3.14, a difference of 0.010%), and Scandinavian (3.14, a difference of 0.030%).
| Demographics | Rating | Rank | Average Family Size |
| Alsatians | 0.2 /100 | #291 | Tragic 3.14 |
| Europeans | 0.2 /100 | #292 | Tragic 3.14 |
| Scandinavians | 0.2 /100 | #293 | Tragic 3.14 |
| Immigrants | Croatia | 0.2 /100 | #294 | Tragic 3.14 |
| Austrians | 0.2 /100 | #295 | Tragic 3.14 |
| Ukrainians | 0.2 /100 | #296 | Tragic 3.14 |
| Immigrants | Western Europe | 0.2 /100 | #297 | Tragic 3.14 |
| Colville | 0.2 /100 | #298 | Tragic 3.14 |
| Canadians | 0.2 /100 | #299 | Tragic 3.14 |
| Immigrants | Sweden | 0.2 /100 | #300 | Tragic 3.14 |
| Macedonians | 0.2 /100 | #301 | Tragic 3.13 |
| Immigrants | Latvia | 0.2 /100 | #302 | Tragic 3.13 |
| British | 0.2 /100 | #303 | Tragic 3.13 |
| Immigrants | Switzerland | 0.2 /100 | #304 | Tragic 3.13 |
| Australians | 0.1 /100 | #305 | Tragic 3.13 |