Aleut vs Russian Nursery School
COMPARE
Aleut
Russian
Nursery School
Nursery School Comparison
Aleuts
Russians
98.7%
NURSERY SCHOOL
100.0/ 100
METRIC RATING
17th/ 347
METRIC RANK
98.4%
NURSERY SCHOOL
99.6/ 100
METRIC RATING
68th/ 347
METRIC RANK
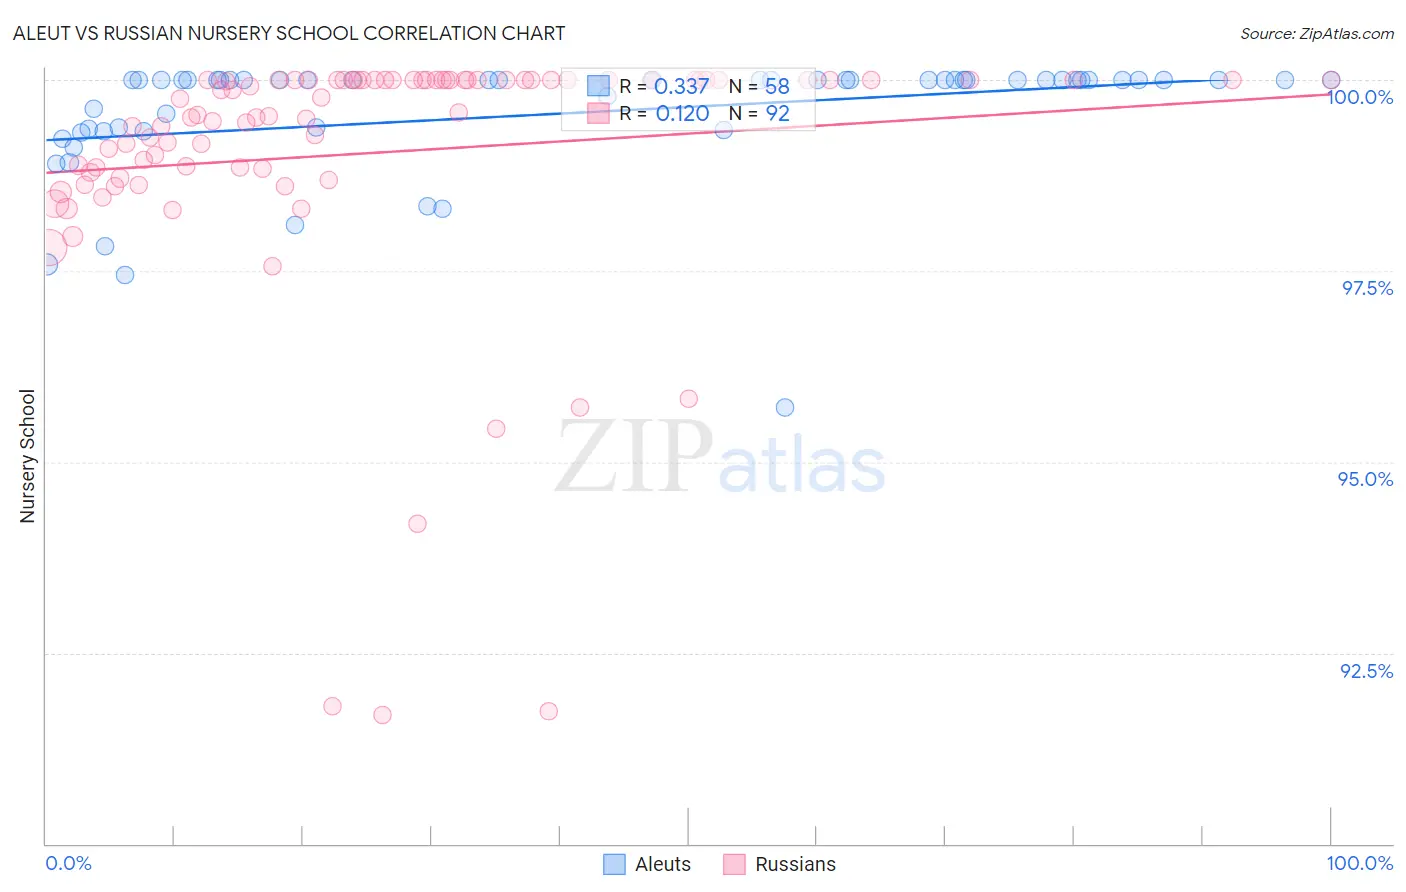
Aleut vs Russian Nursery School Correlation Chart
The statistical analysis conducted on geographies consisting of 61,781,127 people shows a mild positive correlation between the proportion of Aleuts and percentage of population with at least nursery school education in the United States with a correlation coefficient (R) of 0.337 and weighted average of 98.7%. Similarly, the statistical analysis conducted on geographies consisting of 512,259,139 people shows a poor positive correlation between the proportion of Russians and percentage of population with at least nursery school education in the United States with a correlation coefficient (R) of 0.120 and weighted average of 98.4%, a difference of 0.27%.
Nursery School Correlation Summary
| Measurement | Aleut | Russian |
| Minimum | 95.7% | 91.7% |
| Maximum | 100.0% | 100.0% |
| Range | 4.3% | 8.3% |
| Mean | 99.6% | 99.0% |
| Median | 100.0% | 99.7% |
| Interquartile 25% (IQ1) | 99.3% | 98.8% |
| Interquartile 75% (IQ3) | 100.0% | 100.0% |
| Interquartile Range (IQR) | 0.65% | 1.2% |
| Standard Deviation (Sample) | 0.84% | 1.7% |
| Standard Deviation (Population) | 0.83% | 1.7% |
Similar Demographics by Nursery School
Demographics Similar to Aleuts by Nursery School
In terms of nursery school, the demographic groups most similar to Aleuts are Scottish (98.7%, a difference of 0.0%), Dutch (98.7%, a difference of 0.0%), Swedish (98.7%, a difference of 0.020%), Irish (98.6%, a difference of 0.020%), and English (98.7%, a difference of 0.030%).
| Demographics | Rating | Rank | Nursery School |
| Germans | 100.0 /100 | #10 | Exceptional 98.7% |
| Tlingit-Haida | 100.0 /100 | #11 | Exceptional 98.7% |
| Slovenes | 100.0 /100 | #12 | Exceptional 98.7% |
| English | 100.0 /100 | #13 | Exceptional 98.7% |
| Carpatho Rusyns | 100.0 /100 | #14 | Exceptional 98.7% |
| Swedes | 100.0 /100 | #15 | Exceptional 98.7% |
| Scottish | 100.0 /100 | #16 | Exceptional 98.7% |
| Aleuts | 100.0 /100 | #17 | Exceptional 98.7% |
| Dutch | 100.0 /100 | #18 | Exceptional 98.7% |
| Irish | 100.0 /100 | #19 | Exceptional 98.6% |
| Pennsylvania Germans | 100.0 /100 | #20 | Exceptional 98.6% |
| Finns | 100.0 /100 | #21 | Exceptional 98.6% |
| Lithuanians | 100.0 /100 | #22 | Exceptional 98.6% |
| Poles | 100.0 /100 | #23 | Exceptional 98.6% |
| Danes | 100.0 /100 | #24 | Exceptional 98.6% |
Demographics Similar to Russians by Nursery School
In terms of nursery school, the demographic groups most similar to Russians are Immigrants from Northern Europe (98.4%, a difference of 0.0%), Immigrants from Austria (98.4%, a difference of 0.0%), Cheyenne (98.4%, a difference of 0.0%), Serbian (98.4%, a difference of 0.0%), and Canadian (98.4%, a difference of 0.010%).
| Demographics | Rating | Rank | Nursery School |
| New Zealanders | 99.7 /100 | #61 | Exceptional 98.4% |
| Creek | 99.7 /100 | #62 | Exceptional 98.4% |
| Immigrants | North America | 99.7 /100 | #63 | Exceptional 98.4% |
| Greeks | 99.7 /100 | #64 | Exceptional 98.4% |
| Maltese | 99.7 /100 | #65 | Exceptional 98.4% |
| Canadians | 99.7 /100 | #66 | Exceptional 98.4% |
| Immigrants | Northern Europe | 99.6 /100 | #67 | Exceptional 98.4% |
| Russians | 99.6 /100 | #68 | Exceptional 98.4% |
| Immigrants | Austria | 99.6 /100 | #69 | Exceptional 98.4% |
| Cheyenne | 99.6 /100 | #70 | Exceptional 98.4% |
| Serbians | 99.6 /100 | #71 | Exceptional 98.4% |
| Chickasaw | 99.6 /100 | #72 | Exceptional 98.4% |
| Cajuns | 99.4 /100 | #73 | Exceptional 98.4% |
| Immigrants | Netherlands | 99.4 /100 | #74 | Exceptional 98.4% |
| Cherokee | 99.3 /100 | #75 | Exceptional 98.3% |