Immigrants from North Macedonia vs Immigrants from South Africa Single Mother Households
COMPARE
Immigrants from North Macedonia
Immigrants from South Africa
Single Mother Households
Single Mother Households Comparison
Immigrants from North Macedonia
Immigrants from South Africa
5.6%
SINGLE MOTHER HOUSEHOLDS
98.6/ 100
METRIC RATING
63rd/ 347
METRIC RANK
5.7%
SINGLE MOTHER HOUSEHOLDS
96.3/ 100
METRIC RATING
98th/ 347
METRIC RANK
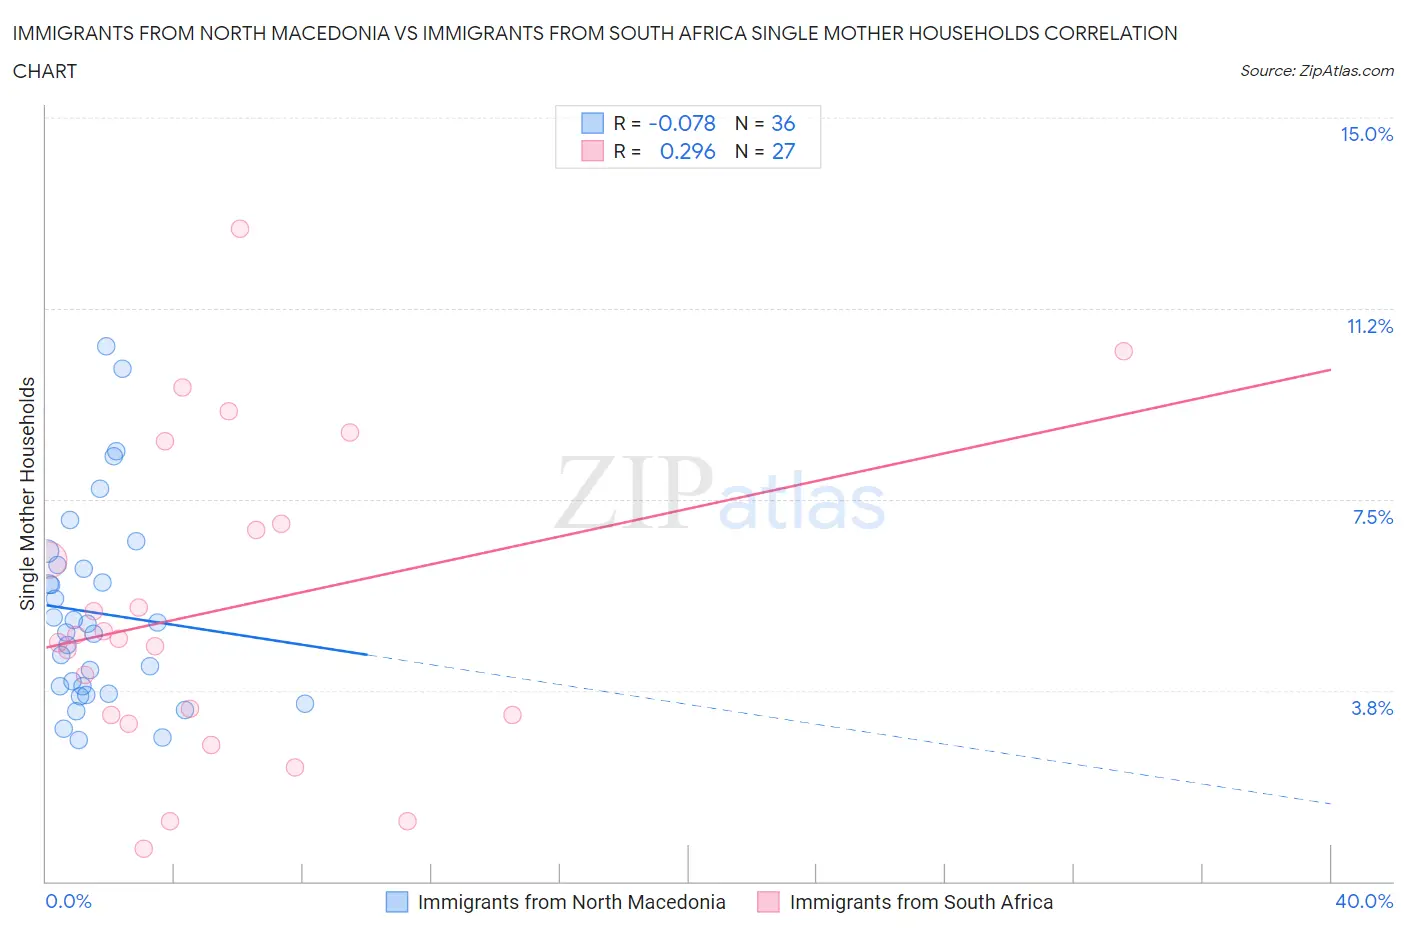
Immigrants from North Macedonia vs Immigrants from South Africa Single Mother Households Correlation Chart
The statistical analysis conducted on geographies consisting of 74,285,342 people shows a slight negative correlation between the proportion of Immigrants from North Macedonia and percentage of single mother households in the United States with a correlation coefficient (R) of -0.078 and weighted average of 5.6%. Similarly, the statistical analysis conducted on geographies consisting of 232,880,827 people shows a weak positive correlation between the proportion of Immigrants from South Africa and percentage of single mother households in the United States with a correlation coefficient (R) of 0.296 and weighted average of 5.7%, a difference of 3.1%.
Single Mother Households Correlation Summary
| Measurement | Immigrants from North Macedonia | Immigrants from South Africa |
| Minimum | 2.8% | 0.63% |
| Maximum | 10.5% | 12.8% |
| Range | 7.7% | 12.2% |
| Mean | 5.3% | 5.3% |
| Median | 5.0% | 4.8% |
| Interquartile 25% (IQ1) | 3.8% | 3.3% |
| Interquartile 75% (IQ3) | 6.2% | 7.0% |
| Interquartile Range (IQR) | 2.4% | 3.8% |
| Standard Deviation (Sample) | 1.9% | 3.0% |
| Standard Deviation (Population) | 1.9% | 3.0% |
Similar Demographics by Single Mother Households
Demographics Similar to Immigrants from North Macedonia by Single Mother Households
In terms of single mother households, the demographic groups most similar to Immigrants from North Macedonia are Immigrants from France (5.6%, a difference of 0.040%), Polish (5.6%, a difference of 0.070%), Australian (5.6%, a difference of 0.080%), Greek (5.6%, a difference of 0.080%), and Immigrants from Norway (5.6%, a difference of 0.15%).
| Demographics | Rating | Rank | Single Mother Households |
| Immigrants | Romania | 99.0 /100 | #56 | Exceptional 5.5% |
| Immigrants | Europe | 99.0 /100 | #57 | Exceptional 5.5% |
| Danes | 98.9 /100 | #58 | Exceptional 5.5% |
| Luxembourgers | 98.7 /100 | #59 | Exceptional 5.6% |
| Immigrants | Norway | 98.7 /100 | #60 | Exceptional 5.6% |
| Australians | 98.7 /100 | #61 | Exceptional 5.6% |
| Poles | 98.6 /100 | #62 | Exceptional 5.6% |
| Immigrants | North Macedonia | 98.6 /100 | #63 | Exceptional 5.6% |
| Immigrants | France | 98.6 /100 | #64 | Exceptional 5.6% |
| Greeks | 98.6 /100 | #65 | Exceptional 5.6% |
| Immigrants | Canada | 98.5 /100 | #66 | Exceptional 5.6% |
| Italians | 98.5 /100 | #67 | Exceptional 5.6% |
| Immigrants | Bulgaria | 98.5 /100 | #68 | Exceptional 5.6% |
| Asians | 98.5 /100 | #69 | Exceptional 5.6% |
| Immigrants | Eastern Europe | 98.4 /100 | #70 | Exceptional 5.6% |
Demographics Similar to Immigrants from South Africa by Single Mother Households
In terms of single mother households, the demographic groups most similar to Immigrants from South Africa are Tlingit-Haida (5.7%, a difference of 0.040%), Immigrants from Poland (5.8%, a difference of 0.050%), Scandinavian (5.8%, a difference of 0.070%), Austrian (5.7%, a difference of 0.090%), and German (5.8%, a difference of 0.10%).
| Demographics | Rating | Rank | Single Mother Households |
| Europeans | 97.0 /100 | #91 | Exceptional 5.7% |
| Immigrants | Western Asia | 96.7 /100 | #92 | Exceptional 5.7% |
| Serbians | 96.7 /100 | #93 | Exceptional 5.7% |
| Basques | 96.7 /100 | #94 | Exceptional 5.7% |
| Slovaks | 96.6 /100 | #95 | Exceptional 5.7% |
| Austrians | 96.4 /100 | #96 | Exceptional 5.7% |
| Tlingit-Haida | 96.4 /100 | #97 | Exceptional 5.7% |
| Immigrants | South Africa | 96.3 /100 | #98 | Exceptional 5.7% |
| Immigrants | Poland | 96.3 /100 | #99 | Exceptional 5.8% |
| Scandinavians | 96.2 /100 | #100 | Exceptional 5.8% |
| Germans | 96.2 /100 | #101 | Exceptional 5.8% |
| English | 96.2 /100 | #102 | Exceptional 5.8% |
| Scottish | 96.2 /100 | #103 | Exceptional 5.8% |
| Northern Europeans | 96.2 /100 | #104 | Exceptional 5.8% |
| Taiwanese | 96.1 /100 | #105 | Exceptional 5.8% |