Albanian vs Immigrants from Romania 7th Grade
COMPARE
Albanian
Immigrants from Romania
7th Grade
7th Grade Comparison
Albanians
Immigrants from Romania
96.3%
7TH GRADE
82.6/ 100
METRIC RATING
149th/ 347
METRIC RANK
96.4%
7TH GRADE
93.2/ 100
METRIC RATING
128th/ 347
METRIC RANK
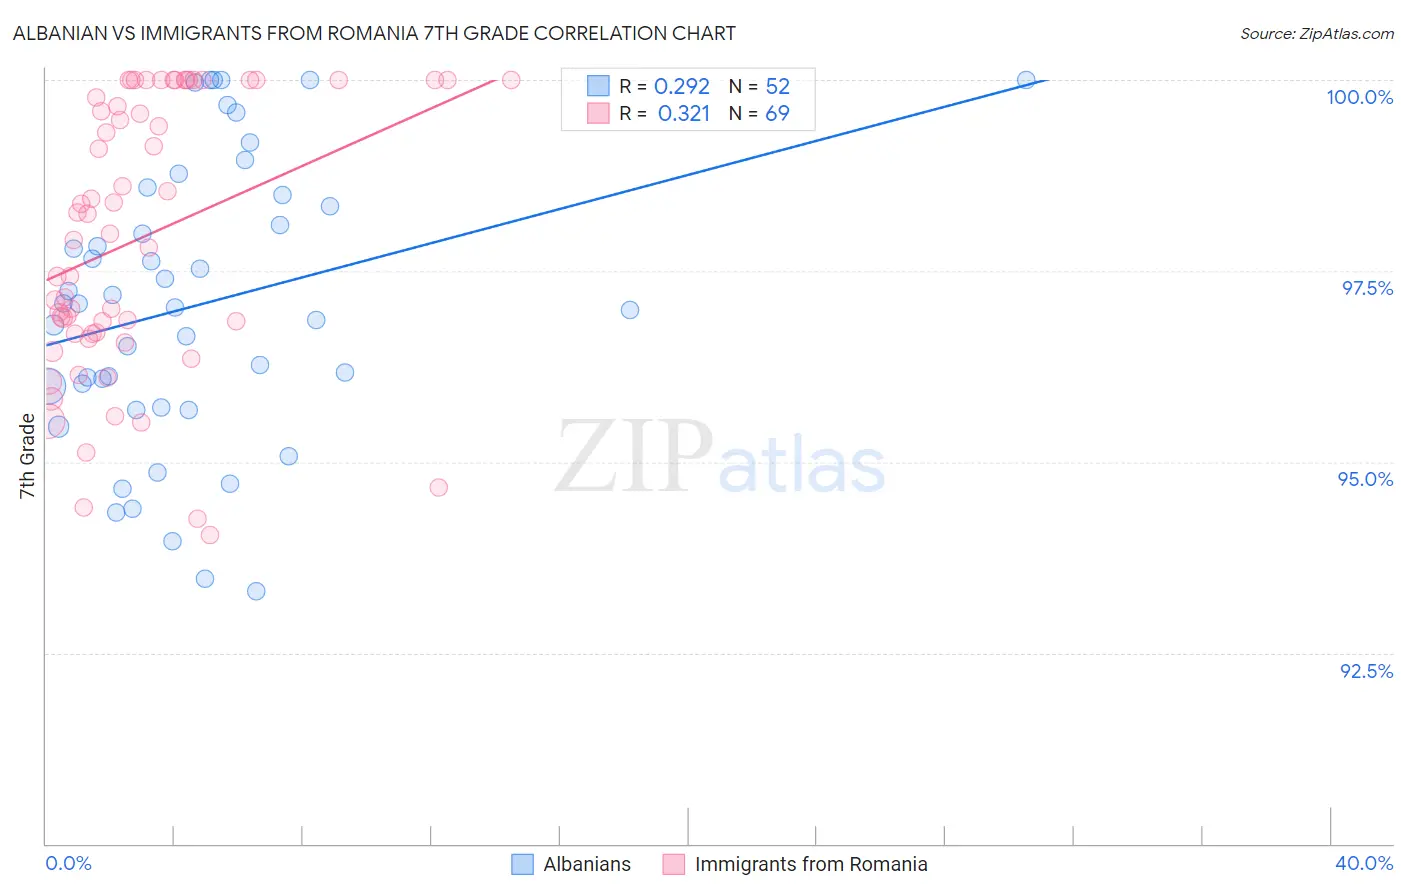
Albanian vs Immigrants from Romania 7th Grade Correlation Chart
The statistical analysis conducted on geographies consisting of 193,265,850 people shows a weak positive correlation between the proportion of Albanians and percentage of population with at least 7th grade education in the United States with a correlation coefficient (R) of 0.292 and weighted average of 96.3%. Similarly, the statistical analysis conducted on geographies consisting of 257,008,799 people shows a mild positive correlation between the proportion of Immigrants from Romania and percentage of population with at least 7th grade education in the United States with a correlation coefficient (R) of 0.321 and weighted average of 96.4%, a difference of 0.16%.
7th Grade Correlation Summary
| Measurement | Albanian | Immigrants from Romania |
| Minimum | 93.3% | 94.0% |
| Maximum | 100.0% | 100.0% |
| Range | 6.7% | 6.0% |
| Mean | 97.1% | 97.9% |
| Median | 97.0% | 98.0% |
| Interquartile 25% (IQ1) | 95.9% | 96.7% |
| Interquartile 75% (IQ3) | 98.4% | 100.0% |
| Interquartile Range (IQR) | 2.6% | 3.3% |
| Standard Deviation (Sample) | 1.8% | 1.8% |
| Standard Deviation (Population) | 1.8% | 1.8% |
Similar Demographics by 7th Grade
Demographics Similar to Albanians by 7th Grade
In terms of 7th grade, the demographic groups most similar to Albanians are French American Indian (96.3%, a difference of 0.0%), Israeli (96.3%, a difference of 0.0%), Immigrants from Belarus (96.3%, a difference of 0.0%), Blackfeet (96.3%, a difference of 0.010%), and Immigrants from Eastern Europe (96.3%, a difference of 0.010%).
| Demographics | Rating | Rank | 7th Grade |
| Burmese | 87.1 /100 | #142 | Excellent 96.3% |
| Spanish | 86.6 /100 | #143 | Excellent 96.3% |
| Immigrants | Greece | 85.9 /100 | #144 | Excellent 96.3% |
| Blackfeet | 83.9 /100 | #145 | Excellent 96.3% |
| Immigrants | Eastern Europe | 83.7 /100 | #146 | Excellent 96.3% |
| French American Indians | 83.1 /100 | #147 | Excellent 96.3% |
| Israelis | 82.8 /100 | #148 | Excellent 96.3% |
| Albanians | 82.6 /100 | #149 | Excellent 96.3% |
| Immigrants | Belarus | 82.4 /100 | #150 | Excellent 96.3% |
| Hopi | 81.6 /100 | #151 | Excellent 96.3% |
| Immigrants | Russia | 78.4 /100 | #152 | Good 96.2% |
| Seminole | 78.1 /100 | #153 | Good 96.2% |
| Immigrants | Israel | 77.6 /100 | #154 | Good 96.2% |
| Immigrants | Jordan | 77.0 /100 | #155 | Good 96.2% |
| Kenyans | 76.2 /100 | #156 | Good 96.2% |
Demographics Similar to Immigrants from Romania by 7th Grade
In terms of 7th grade, the demographic groups most similar to Immigrants from Romania are Immigrants from Bosnia and Herzegovina (96.4%, a difference of 0.0%), Immigrants from North Macedonia (96.4%, a difference of 0.0%), Palestinian (96.4%, a difference of 0.010%), Immigrants from Serbia (96.4%, a difference of 0.010%), and Immigrants from Bulgaria (96.4%, a difference of 0.020%).
| Demographics | Rating | Rank | 7th Grade |
| Cheyenne | 94.9 /100 | #121 | Exceptional 96.5% |
| Immigrants | Europe | 94.8 /100 | #122 | Exceptional 96.5% |
| Immigrants | France | 94.7 /100 | #123 | Exceptional 96.5% |
| Immigrants | Switzerland | 94.5 /100 | #124 | Exceptional 96.5% |
| Immigrants | Bulgaria | 94.0 /100 | #125 | Exceptional 96.4% |
| Palestinians | 93.5 /100 | #126 | Exceptional 96.4% |
| Immigrants | Bosnia and Herzegovina | 93.3 /100 | #127 | Exceptional 96.4% |
| Immigrants | Romania | 93.2 /100 | #128 | Exceptional 96.4% |
| Immigrants | North Macedonia | 93.1 /100 | #129 | Exceptional 96.4% |
| Immigrants | Serbia | 92.8 /100 | #130 | Exceptional 96.4% |
| Filipinos | 92.1 /100 | #131 | Exceptional 96.4% |
| Colville | 91.7 /100 | #132 | Exceptional 96.4% |
| Hmong | 91.5 /100 | #133 | Exceptional 96.4% |
| Soviet Union | 91.2 /100 | #134 | Exceptional 96.4% |
| Immigrants | Kuwait | 91.1 /100 | #135 | Exceptional 96.4% |