Albanian vs Crow Average Family Size
COMPARE
Albanian
Crow
Average Family Size
Average Family Size Comparison
Albanians
Crow
3.17
AVERAGE FAMILY SIZE
1.5/ 100
METRIC RATING
257th/ 347
METRIC RANK
3.82
AVERAGE FAMILY SIZE
100/ 100
METRIC RATING
2nd/ 347
METRIC RANK
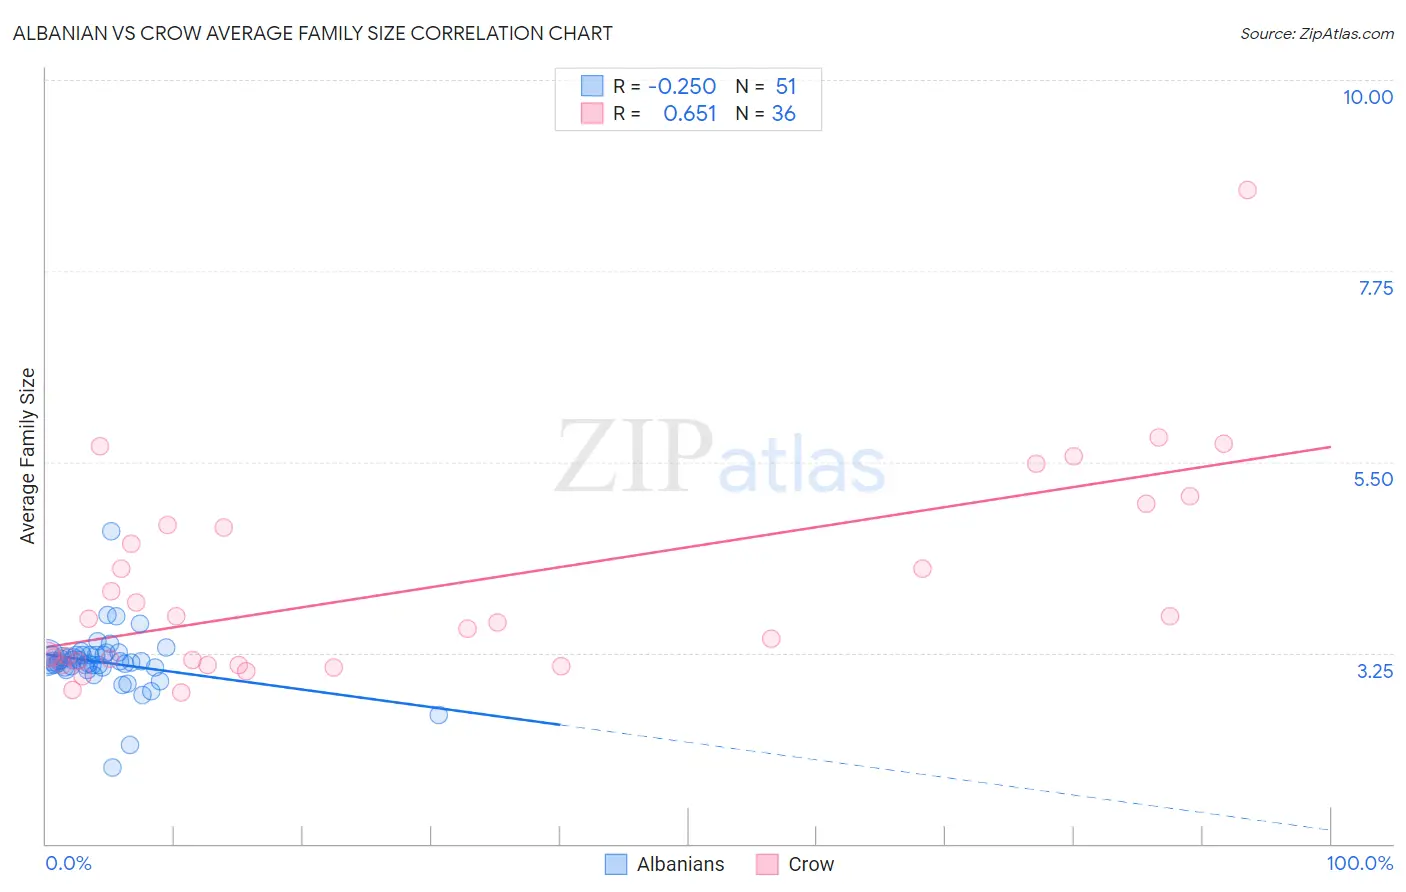
Albanian vs Crow Average Family Size Correlation Chart
The statistical analysis conducted on geographies consisting of 193,186,402 people shows a weak negative correlation between the proportion of Albanians and average family size in the United States with a correlation coefficient (R) of -0.250 and weighted average of 3.17. Similarly, the statistical analysis conducted on geographies consisting of 59,202,817 people shows a significant positive correlation between the proportion of Crow and average family size in the United States with a correlation coefficient (R) of 0.651 and weighted average of 3.82, a difference of 20.8%.
Average Family Size Correlation Summary
| Measurement | Albanian | Crow |
| Minimum | 1.90 | 2.78 |
| Maximum | 4.68 | 8.70 |
| Range | 2.78 | 5.92 |
| Mean | 3.14 | 4.03 |
| Median | 3.15 | 3.63 |
| Interquartile 25% (IQ1) | 3.08 | 3.13 |
| Interquartile 75% (IQ3) | 3.22 | 4.74 |
| Interquartile Range (IQR) | 0.15 | 1.61 |
| Standard Deviation (Sample) | 0.37 | 1.23 |
| Standard Deviation (Population) | 0.37 | 1.22 |
Similar Demographics by Average Family Size
Demographics Similar to Albanians by Average Family Size
In terms of average family size, the demographic groups most similar to Albanians are Immigrants from Kazakhstan (3.17, a difference of 0.020%), Cape Verdean (3.17, a difference of 0.050%), Turkish (3.16, a difference of 0.050%), Potawatomi (3.16, a difference of 0.050%), and Immigrants from Hungary (3.17, a difference of 0.060%).
| Demographics | Rating | Rank | Average Family Size |
| Puget Sound Salish | 1.9 /100 | #250 | Tragic 3.17 |
| Immigrants | Spain | 1.8 /100 | #251 | Tragic 3.17 |
| Immigrants | Saudi Arabia | 1.7 /100 | #252 | Tragic 3.17 |
| South Africans | 1.7 /100 | #253 | Tragic 3.17 |
| Immigrants | Hungary | 1.7 /100 | #254 | Tragic 3.17 |
| Cape Verdeans | 1.6 /100 | #255 | Tragic 3.17 |
| Immigrants | Kazakhstan | 1.5 /100 | #256 | Tragic 3.17 |
| Albanians | 1.5 /100 | #257 | Tragic 3.17 |
| Turks | 1.3 /100 | #258 | Tragic 3.16 |
| Potawatomi | 1.3 /100 | #259 | Tragic 3.16 |
| Immigrants | Albania | 1.3 /100 | #260 | Tragic 3.16 |
| Immigrants | North Macedonia | 1.3 /100 | #261 | Tragic 3.16 |
| Immigrants | Russia | 1.3 /100 | #262 | Tragic 3.16 |
| Immigrants | Bulgaria | 1.0 /100 | #263 | Tragic 3.16 |
| Americans | 1.0 /100 | #264 | Tragic 3.16 |
Demographics Similar to Crow by Average Family Size
In terms of average family size, the demographic groups most similar to Crow are Pueblo (3.79, a difference of 0.81%), Pima (3.75, a difference of 2.1%), Yup'ik (4.00, a difference of 4.5%), Navajo (3.65, a difference of 4.9%), and Arapaho (3.64, a difference of 5.2%).
| Demographics | Rating | Rank | Average Family Size |
| Yup'ik | 100 /100 | #1 | Exceptional 4.00 |
| Crow | 100 /100 | #2 | Exceptional 3.82 |
| Pueblo | 100 /100 | #3 | Exceptional 3.79 |
| Pima | 100 /100 | #4 | Exceptional 3.75 |
| Navajo | 100.0 /100 | #5 | Exceptional 3.65 |
| Arapaho | 100.0 /100 | #6 | Exceptional 3.64 |
| Inupiat | 100.0 /100 | #7 | Exceptional 3.63 |
| Immigrants | Yemen | 100.0 /100 | #8 | Exceptional 3.60 |
| Hopi | 100.0 /100 | #9 | Exceptional 3.60 |
| Spanish American Indians | 100.0 /100 | #10 | Exceptional 3.58 |
| Tohono O'odham | 100.0 /100 | #11 | Exceptional 3.53 |
| Immigrants | Mexico | 100.0 /100 | #12 | Exceptional 3.52 |
| Sioux | 100.0 /100 | #13 | Exceptional 3.52 |
| Immigrants | Central America | 100.0 /100 | #14 | Exceptional 3.49 |
| Tongans | 100.0 /100 | #15 | Exceptional 3.49 |