Alaskan Athabascan vs Immigrants from Morocco Currently Married
COMPARE
Alaskan Athabascan
Immigrants from Morocco
Currently Married
Currently Married Comparison
Alaskan Athabascans
Immigrants from Morocco
44.6%
CURRENTLY MARRIED
0.9/ 100
METRIC RATING
235th/ 347
METRIC RANK
45.4%
CURRENTLY MARRIED
5.5/ 100
METRIC RATING
216th/ 347
METRIC RANK
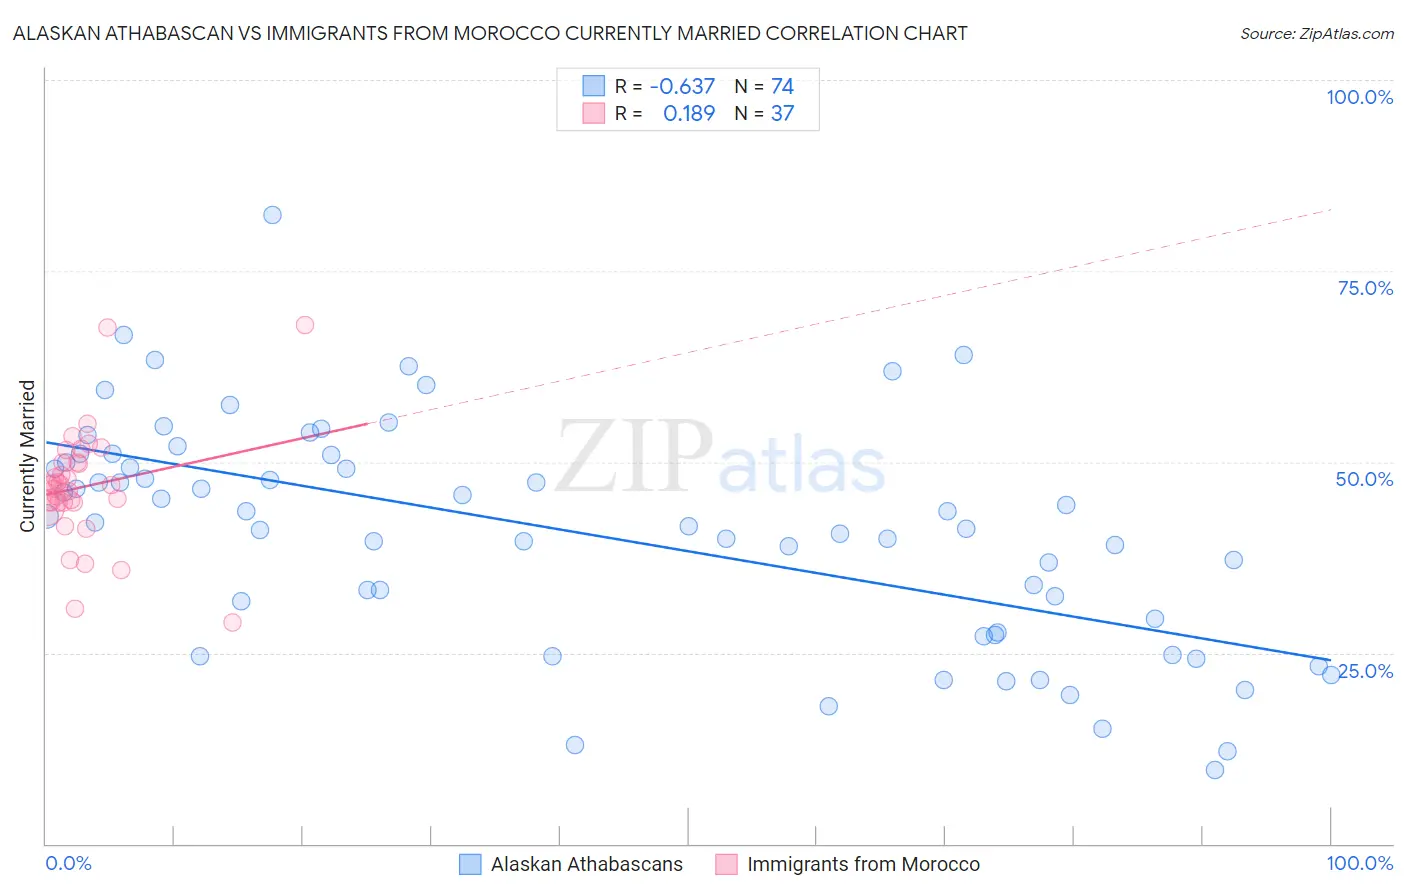
Alaskan Athabascan vs Immigrants from Morocco Currently Married Correlation Chart
The statistical analysis conducted on geographies consisting of 45,820,219 people shows a significant negative correlation between the proportion of Alaskan Athabascans and percentage of population currently married in the United States with a correlation coefficient (R) of -0.637 and weighted average of 44.6%. Similarly, the statistical analysis conducted on geographies consisting of 178,912,438 people shows a poor positive correlation between the proportion of Immigrants from Morocco and percentage of population currently married in the United States with a correlation coefficient (R) of 0.189 and weighted average of 45.4%, a difference of 1.7%.
Currently Married Correlation Summary
| Measurement | Alaskan Athabascan | Immigrants from Morocco |
| Minimum | 9.6% | 29.0% |
| Maximum | 82.4% | 67.9% |
| Range | 72.8% | 38.9% |
| Mean | 40.6% | 46.7% |
| Median | 41.9% | 46.9% |
| Interquartile 25% (IQ1) | 27.7% | 44.6% |
| Interquartile 75% (IQ3) | 49.9% | 49.9% |
| Interquartile Range (IQR) | 22.2% | 5.3% |
| Standard Deviation (Sample) | 14.7% | 7.6% |
| Standard Deviation (Population) | 14.6% | 7.5% |
Demographics Similar to Alaskan Athabascans and Immigrants from Morocco by Currently Married
In terms of currently married, the demographic groups most similar to Alaskan Athabascans are Immigrants from Saudi Arabia (44.7%, a difference of 0.16%), Iroquois (44.7%, a difference of 0.16%), Nepalese (44.7%, a difference of 0.21%), Immigrants from Panama (44.9%, a difference of 0.48%), and Immigrants from Kenya (44.9%, a difference of 0.51%). Similarly, the demographic groups most similar to Immigrants from Morocco are Immigrants from Thailand (45.4%, a difference of 0.080%), German Russian (45.5%, a difference of 0.20%), Panamanian (45.3%, a difference of 0.33%), Immigrants from Portugal (45.2%, a difference of 0.44%), and Kenyan (45.2%, a difference of 0.57%).
| Demographics | Rating | Rank | Currently Married |
| German Russians | 6.7 /100 | #215 | Tragic 45.5% |
| Immigrants | Morocco | 5.5 /100 | #216 | Tragic 45.4% |
| Immigrants | Thailand | 5.1 /100 | #217 | Tragic 45.4% |
| Panamanians | 4.0 /100 | #218 | Tragic 45.3% |
| Immigrants | Portugal | 3.5 /100 | #219 | Tragic 45.2% |
| Kenyans | 3.1 /100 | #220 | Tragic 45.2% |
| Mexicans | 3.0 /100 | #221 | Tragic 45.2% |
| Immigrants | Azores | 2.5 /100 | #222 | Tragic 45.1% |
| Immigrants | Laos | 2.3 /100 | #223 | Tragic 45.0% |
| Immigrants | Uganda | 2.2 /100 | #224 | Tragic 45.0% |
| French American Indians | 2.2 /100 | #225 | Tragic 45.0% |
| Comanche | 2.1 /100 | #226 | Tragic 45.0% |
| Spanish Americans | 2.1 /100 | #227 | Tragic 45.0% |
| Immigrants | Uruguay | 2.0 /100 | #228 | Tragic 45.0% |
| Cree | 1.7 /100 | #229 | Tragic 44.9% |
| Immigrants | Kenya | 1.6 /100 | #230 | Tragic 44.9% |
| Immigrants | Panama | 1.5 /100 | #231 | Tragic 44.9% |
| Nepalese | 1.2 /100 | #232 | Tragic 44.7% |
| Immigrants | Saudi Arabia | 1.1 /100 | #233 | Tragic 44.7% |
| Iroquois | 1.1 /100 | #234 | Tragic 44.7% |
| Alaskan Athabascans | 0.9 /100 | #235 | Tragic 44.6% |