Alaskan Athabascan vs Immigrants from Morocco Male Unemployment
COMPARE
Alaskan Athabascan
Immigrants from Morocco
Male Unemployment
Male Unemployment Comparison
Alaskan Athabascans
Immigrants from Morocco
9.8%
MALE UNEMPLOYMENT
0.0/ 100
METRIC RATING
340th/ 347
METRIC RANK
5.3%
MALE UNEMPLOYMENT
60.2/ 100
METRIC RATING
166th/ 347
METRIC RANK
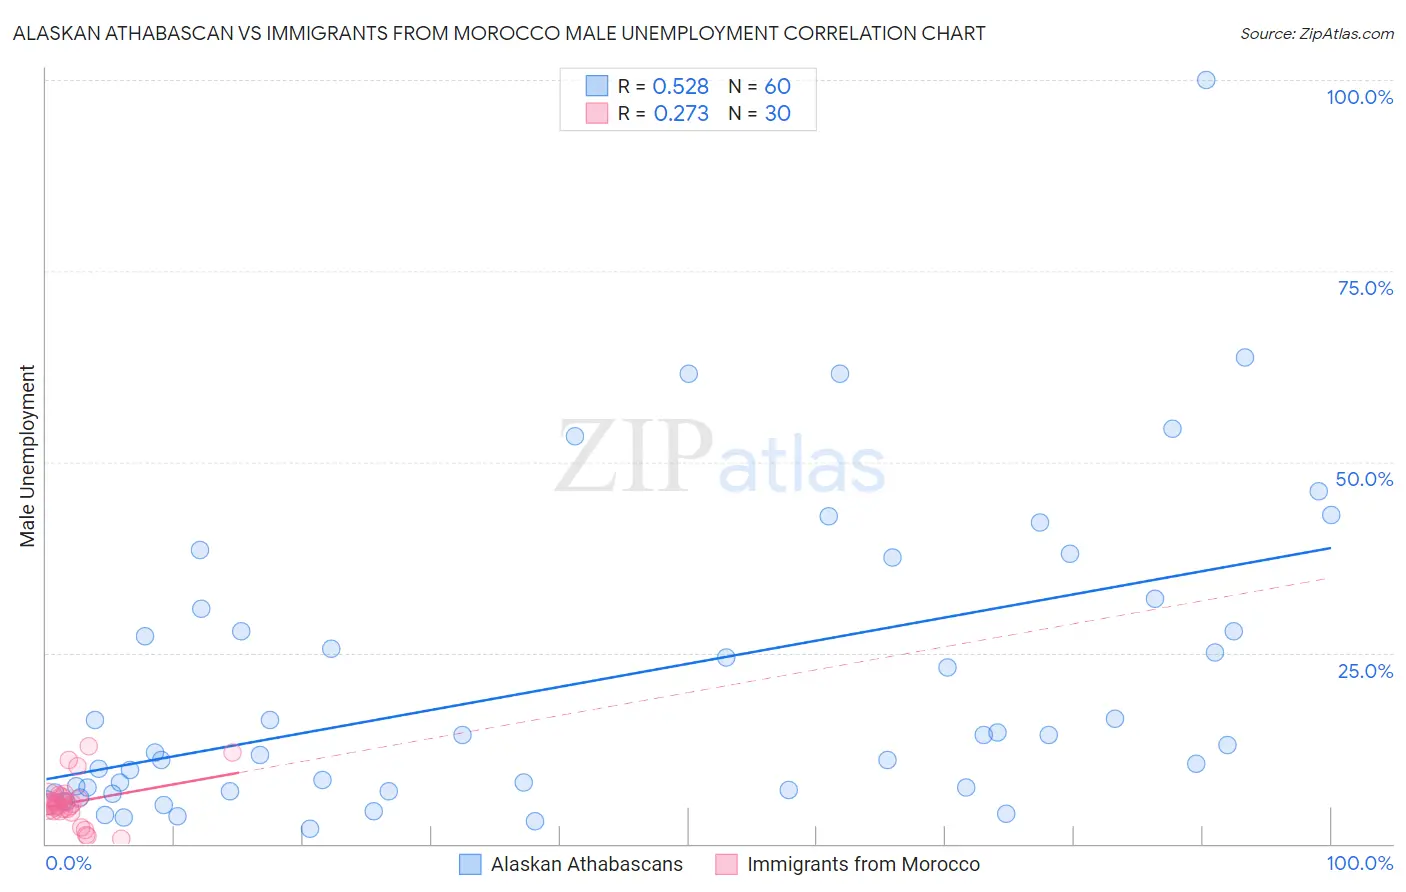
Alaskan Athabascan vs Immigrants from Morocco Male Unemployment Correlation Chart
The statistical analysis conducted on geographies consisting of 45,763,974 people shows a substantial positive correlation between the proportion of Alaskan Athabascans and unemployment rate among males in the United States with a correlation coefficient (R) of 0.528 and weighted average of 9.8%. Similarly, the statistical analysis conducted on geographies consisting of 178,783,560 people shows a weak positive correlation between the proportion of Immigrants from Morocco and unemployment rate among males in the United States with a correlation coefficient (R) of 0.273 and weighted average of 5.3%, a difference of 86.3%.
Male Unemployment Correlation Summary
| Measurement | Alaskan Athabascan | Immigrants from Morocco |
| Minimum | 2.0% | 0.60% |
| Maximum | 100.0% | 12.7% |
| Range | 98.0% | 12.1% |
| Mean | 20.9% | 5.4% |
| Median | 12.5% | 5.2% |
| Interquartile 25% (IQ1) | 6.8% | 4.4% |
| Interquartile 75% (IQ3) | 29.4% | 6.0% |
| Interquartile Range (IQR) | 22.5% | 1.6% |
| Standard Deviation (Sample) | 19.9% | 2.9% |
| Standard Deviation (Population) | 19.7% | 2.9% |
Similar Demographics by Male Unemployment
Demographics Similar to Alaskan Athabascans by Male Unemployment
In terms of male unemployment, the demographic groups most similar to Alaskan Athabascans are Cheyenne (9.8%, a difference of 0.080%), Navajo (9.8%, a difference of 0.28%), Tohono O'odham (10.2%, a difference of 3.7%), Crow (10.6%, a difference of 8.2%), and Hopi (10.8%, a difference of 10.0%).
| Demographics | Rating | Rank | Male Unemployment |
| Sioux | 0.0 /100 | #333 | Tragic 8.4% |
| Tsimshian | 0.0 /100 | #334 | Tragic 8.5% |
| Pueblo | 0.0 /100 | #335 | Tragic 8.5% |
| Yuman | 0.0 /100 | #336 | Tragic 8.6% |
| Puerto Ricans | 0.0 /100 | #337 | Tragic 8.6% |
| Apache | 0.0 /100 | #338 | Tragic 8.6% |
| Cheyenne | 0.0 /100 | #339 | Tragic 9.8% |
| Alaskan Athabascans | 0.0 /100 | #340 | Tragic 9.8% |
| Navajo | 0.0 /100 | #341 | Tragic 9.8% |
| Tohono O'odham | 0.0 /100 | #342 | Tragic 10.2% |
| Crow | 0.0 /100 | #343 | Tragic 10.6% |
| Hopi | 0.0 /100 | #344 | Tragic 10.8% |
| Arapaho | 0.0 /100 | #345 | Tragic 11.0% |
| Inupiat | 0.0 /100 | #346 | Tragic 12.1% |
| Yup'ik | 0.0 /100 | #347 | Tragic 16.4% |
Demographics Similar to Immigrants from Morocco by Male Unemployment
In terms of male unemployment, the demographic groups most similar to Immigrants from Morocco are South American (5.3%, a difference of 0.030%), Afghan (5.3%, a difference of 0.11%), Immigrants from Vietnam (5.3%, a difference of 0.12%), Immigrants from Ireland (5.3%, a difference of 0.15%), and Immigrants from Congo (5.3%, a difference of 0.17%).
| Demographics | Rating | Rank | Male Unemployment |
| Indonesians | 71.2 /100 | #159 | Good 5.2% |
| Immigrants | Norway | 71.0 /100 | #160 | Good 5.2% |
| Immigrants | China | 70.6 /100 | #161 | Good 5.2% |
| Immigrants | Egypt | 65.9 /100 | #162 | Good 5.2% |
| Immigrants | Hong Kong | 65.7 /100 | #163 | Good 5.2% |
| Afghans | 62.0 /100 | #164 | Good 5.3% |
| South Americans | 60.6 /100 | #165 | Good 5.3% |
| Immigrants | Morocco | 60.2 /100 | #166 | Good 5.3% |
| Immigrants | Vietnam | 58.1 /100 | #167 | Average 5.3% |
| Immigrants | Ireland | 57.7 /100 | #168 | Average 5.3% |
| Immigrants | Congo | 57.4 /100 | #169 | Average 5.3% |
| Immigrants | Eastern Europe | 54.1 /100 | #170 | Average 5.3% |
| Peruvians | 51.9 /100 | #171 | Average 5.3% |
| Immigrants | Kazakhstan | 50.8 /100 | #172 | Average 5.3% |
| Immigrants | Russia | 50.7 /100 | #173 | Average 5.3% |