Afghan vs Pima Currently Married
COMPARE
Afghan
Pima
Currently Married
Currently Married Comparison
Afghans
Pima
47.3%
CURRENTLY MARRIED
81.8/ 100
METRIC RATING
132nd/ 347
METRIC RANK
35.9%
CURRENTLY MARRIED
0.0/ 100
METRIC RATING
347th/ 347
METRIC RANK
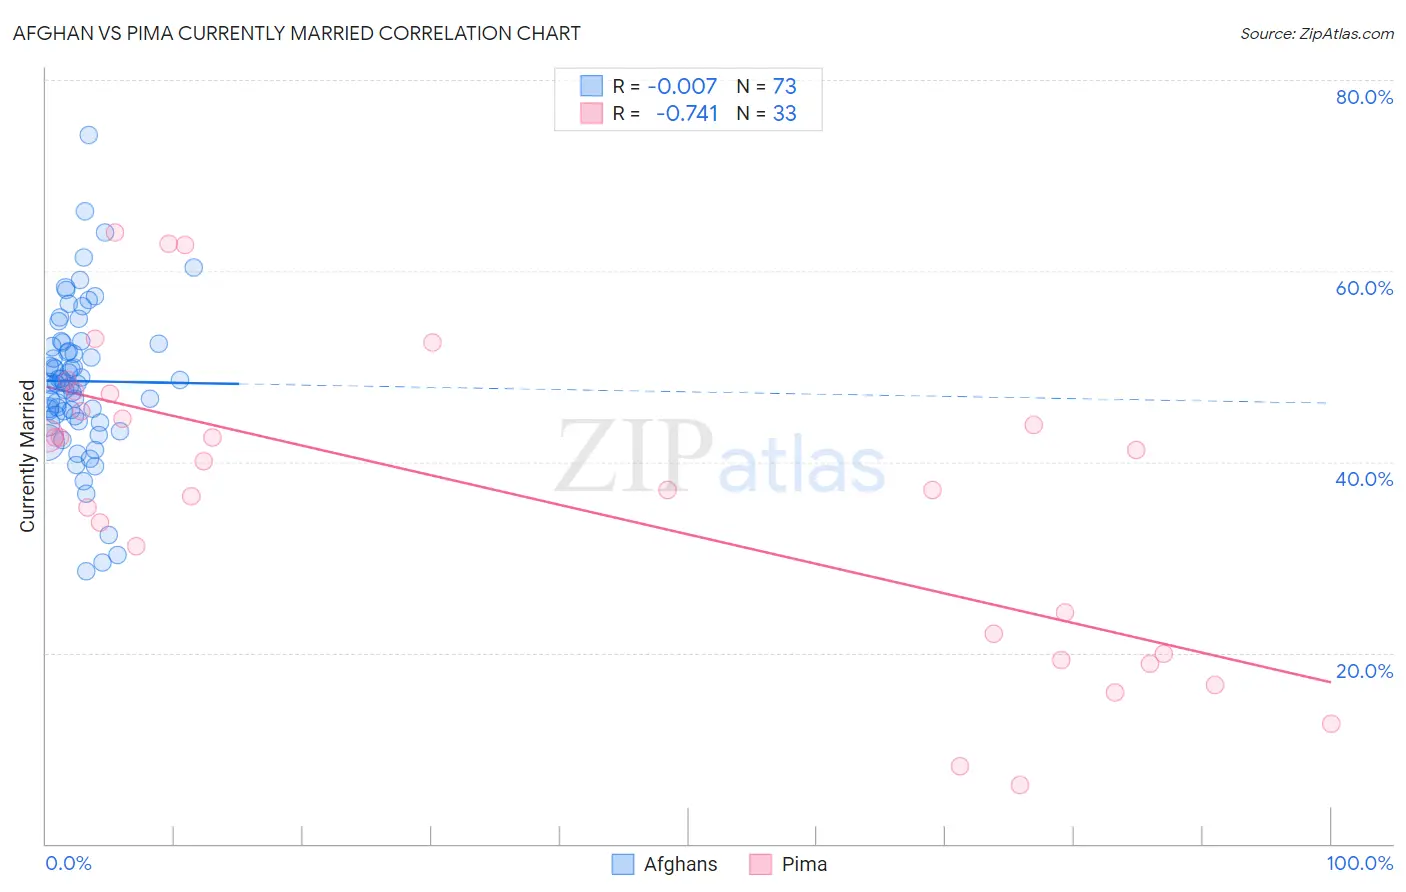
Afghan vs Pima Currently Married Correlation Chart
The statistical analysis conducted on geographies consisting of 148,861,336 people shows no correlation between the proportion of Afghans and percentage of population currently married in the United States with a correlation coefficient (R) of -0.007 and weighted average of 47.3%. Similarly, the statistical analysis conducted on geographies consisting of 61,552,342 people shows a strong negative correlation between the proportion of Pima and percentage of population currently married in the United States with a correlation coefficient (R) of -0.741 and weighted average of 35.9%, a difference of 31.6%.
Currently Married Correlation Summary
| Measurement | Afghan | Pima |
| Minimum | 28.6% | 6.2% |
| Maximum | 74.2% | 64.0% |
| Range | 45.6% | 57.8% |
| Mean | 48.5% | 36.3% |
| Median | 48.3% | 40.1% |
| Interquartile 25% (IQ1) | 44.5% | 21.0% |
| Interquartile 75% (IQ3) | 52.5% | 46.2% |
| Interquartile Range (IQR) | 8.0% | 25.2% |
| Standard Deviation (Sample) | 8.0% | 15.6% |
| Standard Deviation (Population) | 7.9% | 15.4% |
Similar Demographics by Currently Married
Demographics Similar to Afghans by Currently Married
In terms of currently married, the demographic groups most similar to Afghans are Icelander (47.3%, a difference of 0.040%), Immigrants from Malaysia (47.3%, a difference of 0.040%), Immigrants from Australia (47.3%, a difference of 0.050%), Immigrants from Iraq (47.3%, a difference of 0.060%), and Sri Lankan (47.3%, a difference of 0.090%).
| Demographics | Rating | Rank | Currently Married |
| Okinawans | 85.3 /100 | #125 | Excellent 47.4% |
| Immigrants | Jordan | 84.9 /100 | #126 | Excellent 47.4% |
| New Zealanders | 84.9 /100 | #127 | Excellent 47.4% |
| Portuguese | 84.2 /100 | #128 | Excellent 47.3% |
| Sri Lankans | 83.2 /100 | #129 | Excellent 47.3% |
| Immigrants | Iraq | 82.8 /100 | #130 | Excellent 47.3% |
| Icelanders | 82.4 /100 | #131 | Excellent 47.3% |
| Afghans | 81.8 /100 | #132 | Excellent 47.3% |
| Immigrants | Malaysia | 81.1 /100 | #133 | Excellent 47.3% |
| Immigrants | Australia | 81.1 /100 | #134 | Excellent 47.3% |
| Immigrants | Norway | 79.7 /100 | #135 | Good 47.2% |
| Immigrants | Vietnam | 78.2 /100 | #136 | Good 47.2% |
| Paraguayans | 77.8 /100 | #137 | Good 47.2% |
| Pakistanis | 77.5 /100 | #138 | Good 47.2% |
| Yugoslavians | 77.4 /100 | #139 | Good 47.2% |
Demographics Similar to Pima by Currently Married
In terms of currently married, the demographic groups most similar to Pima are Hopi (36.5%, a difference of 1.8%), Tohono O'odham (36.8%, a difference of 2.4%), Immigrants from Cabo Verde (37.8%, a difference of 5.4%), Pueblo (38.2%, a difference of 6.5%), and Immigrants from Dominican Republic (38.9%, a difference of 8.4%).
| Demographics | Rating | Rank | Currently Married |
| Yup'ik | 0.0 /100 | #333 | Tragic 39.9% |
| Puerto Ricans | 0.0 /100 | #334 | Tragic 39.9% |
| Lumbee | 0.0 /100 | #335 | Tragic 39.8% |
| British West Indians | 0.0 /100 | #336 | Tragic 39.8% |
| Blacks/African Americans | 0.0 /100 | #337 | Tragic 39.6% |
| Cape Verdeans | 0.0 /100 | #338 | Tragic 39.6% |
| Dominicans | 0.0 /100 | #339 | Tragic 39.5% |
| Immigrants | Grenada | 0.0 /100 | #340 | Tragic 39.1% |
| Navajo | 0.0 /100 | #341 | Tragic 39.0% |
| Immigrants | Dominican Republic | 0.0 /100 | #342 | Tragic 38.9% |
| Pueblo | 0.0 /100 | #343 | Tragic 38.2% |
| Immigrants | Cabo Verde | 0.0 /100 | #344 | Tragic 37.8% |
| Tohono O'odham | 0.0 /100 | #345 | Tragic 36.8% |
| Hopi | 0.0 /100 | #346 | Tragic 36.5% |
| Pima | 0.0 /100 | #347 | Tragic 35.9% |