Afghan vs Ghanaian Unemployment Among Ages 20 to 24 years
COMPARE
Afghan
Ghanaian
Unemployment Among Ages 20 to 24 years
Unemployment Among Ages 20 to 24 years Comparison
Afghans
Ghanaians
9.6%
UNEMPLOYMENT AMONG AGES 20 TO 24 YEARS
99.9/ 100
METRIC RATING
38th/ 347
METRIC RANK
11.7%
UNEMPLOYMENT AMONG AGES 20 TO 24 YEARS
0.0/ 100
METRIC RATING
283rd/ 347
METRIC RANK
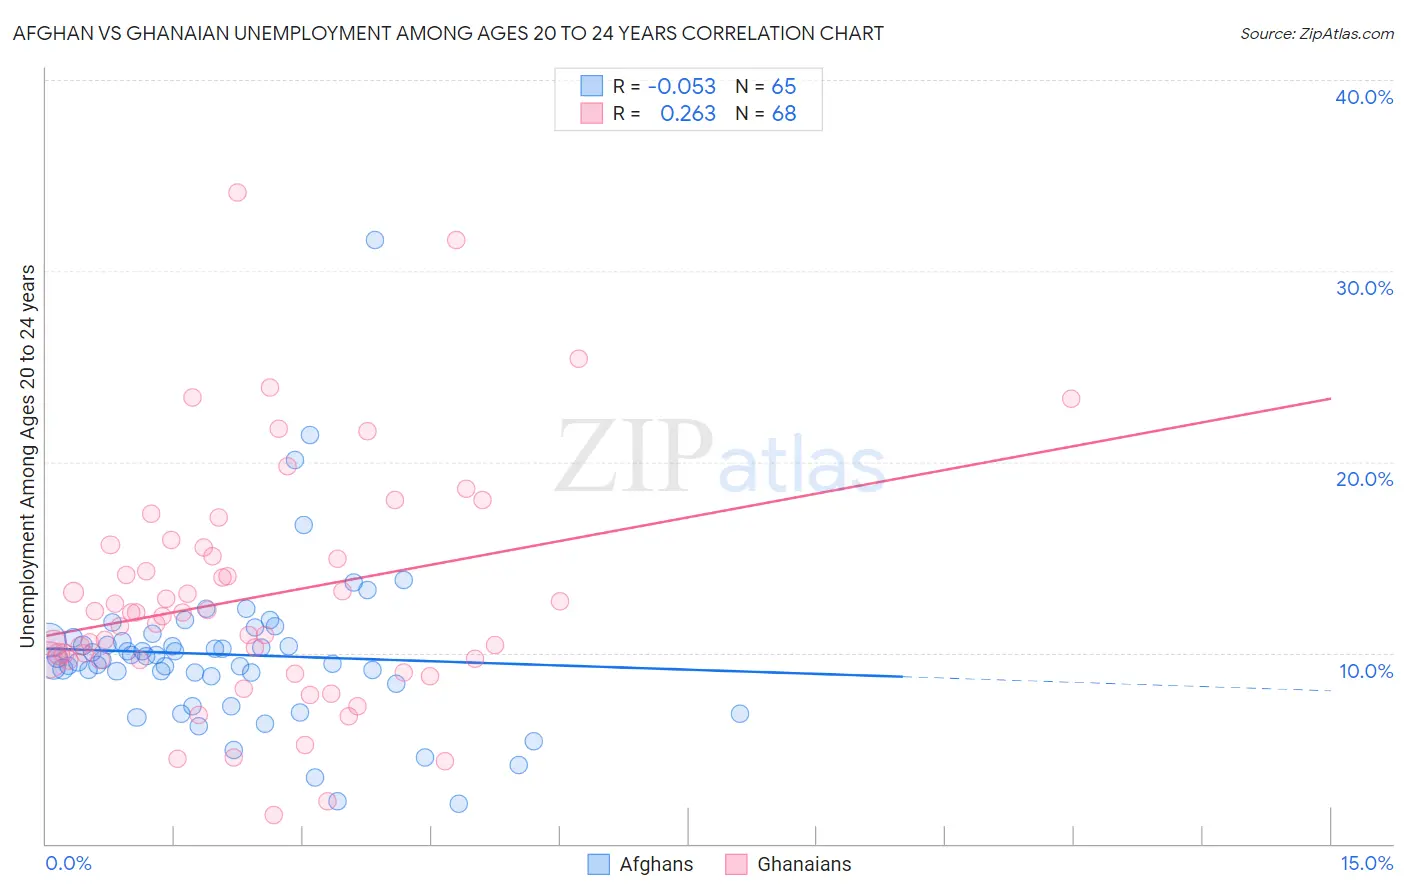
Afghan vs Ghanaian Unemployment Among Ages 20 to 24 years Correlation Chart
The statistical analysis conducted on geographies consisting of 147,858,089 people shows a slight negative correlation between the proportion of Afghans and unemployment rate among population between the ages 20 and 24 in the United States with a correlation coefficient (R) of -0.053 and weighted average of 9.6%. Similarly, the statistical analysis conducted on geographies consisting of 188,668,259 people shows a weak positive correlation between the proportion of Ghanaians and unemployment rate among population between the ages 20 and 24 in the United States with a correlation coefficient (R) of 0.263 and weighted average of 11.7%, a difference of 22.3%.
Unemployment Among Ages 20 to 24 years Correlation Summary
| Measurement | Afghan | Ghanaian |
| Minimum | 2.1% | 1.5% |
| Maximum | 31.6% | 34.1% |
| Range | 29.5% | 32.6% |
| Mean | 9.9% | 12.9% |
| Median | 9.7% | 12.0% |
| Interquartile 25% (IQ1) | 8.6% | 9.6% |
| Interquartile 75% (IQ3) | 10.7% | 15.3% |
| Interquartile Range (IQR) | 2.1% | 5.6% |
| Standard Deviation (Sample) | 4.3% | 6.2% |
| Standard Deviation (Population) | 4.3% | 6.1% |
Similar Demographics by Unemployment Among Ages 20 to 24 years
Demographics Similar to Afghans by Unemployment Among Ages 20 to 24 years
In terms of unemployment among ages 20 to 24 years, the demographic groups most similar to Afghans are Immigrants from Zaire (9.6%, a difference of 0.070%), Belgian (9.6%, a difference of 0.15%), German (9.6%, a difference of 0.18%), Dutch (9.6%, a difference of 0.22%), and Yugoslavian (9.6%, a difference of 0.25%).
| Demographics | Rating | Rank | Unemployment Among Ages 20 to 24 years |
| Immigrants | Eastern Africa | 100.0 /100 | #31 | Exceptional 9.5% |
| Cambodians | 100.0 /100 | #32 | Exceptional 9.5% |
| Australians | 100.0 /100 | #33 | Exceptional 9.6% |
| Yugoslavians | 100.0 /100 | #34 | Exceptional 9.6% |
| Germans | 100.0 /100 | #35 | Exceptional 9.6% |
| Belgians | 100.0 /100 | #36 | Exceptional 9.6% |
| Immigrants | Zaire | 100.0 /100 | #37 | Exceptional 9.6% |
| Afghans | 99.9 /100 | #38 | Exceptional 9.6% |
| Dutch | 99.9 /100 | #39 | Exceptional 9.6% |
| Immigrants | Ethiopia | 99.9 /100 | #40 | Exceptional 9.6% |
| Swiss | 99.9 /100 | #41 | Exceptional 9.7% |
| Immigrants | Saudi Arabia | 99.9 /100 | #42 | Exceptional 9.7% |
| Menominee | 99.8 /100 | #43 | Exceptional 9.7% |
| Europeans | 99.8 /100 | #44 | Exceptional 9.7% |
| Croatians | 99.8 /100 | #45 | Exceptional 9.7% |
Demographics Similar to Ghanaians by Unemployment Among Ages 20 to 24 years
In terms of unemployment among ages 20 to 24 years, the demographic groups most similar to Ghanaians are Immigrants from Western Africa (11.7%, a difference of 0.010%), Soviet Union (11.7%, a difference of 0.050%), Ecuadorian (11.8%, a difference of 0.17%), Immigrants from Ecuador (11.8%, a difference of 0.26%), and U.S. Virgin Islander (11.8%, a difference of 0.32%).
| Demographics | Rating | Rank | Unemployment Among Ages 20 to 24 years |
| Sierra Leoneans | 0.0 /100 | #276 | Tragic 11.5% |
| Africans | 0.0 /100 | #277 | Tragic 11.5% |
| Colville | 0.0 /100 | #278 | Tragic 11.6% |
| Bahamians | 0.0 /100 | #279 | Tragic 11.6% |
| Alaskan Athabascans | 0.0 /100 | #280 | Tragic 11.6% |
| Armenians | 0.0 /100 | #281 | Tragic 11.7% |
| Immigrants | Cameroon | 0.0 /100 | #282 | Tragic 11.7% |
| Ghanaians | 0.0 /100 | #283 | Tragic 11.7% |
| Immigrants | Western Africa | 0.0 /100 | #284 | Tragic 11.7% |
| Soviet Union | 0.0 /100 | #285 | Tragic 11.7% |
| Ecuadorians | 0.0 /100 | #286 | Tragic 11.8% |
| Immigrants | Ecuador | 0.0 /100 | #287 | Tragic 11.8% |
| U.S. Virgin Islanders | 0.0 /100 | #288 | Tragic 11.8% |
| Belizeans | 0.0 /100 | #289 | Tragic 11.8% |
| Immigrants | Caribbean | 0.0 /100 | #290 | Tragic 11.8% |