Yup'ik vs Immigrants from Guyana 8th Grade
COMPARE
Yup'ik
Immigrants from Guyana
8th Grade
8th Grade Comparison
Yup'ik
Immigrants from Guyana
97.0%
8TH GRADE
100.0/ 100
METRIC RATING
32nd/ 347
METRIC RANK
93.8%
8TH GRADE
0.0/ 100
METRIC RATING
306th/ 347
METRIC RANK
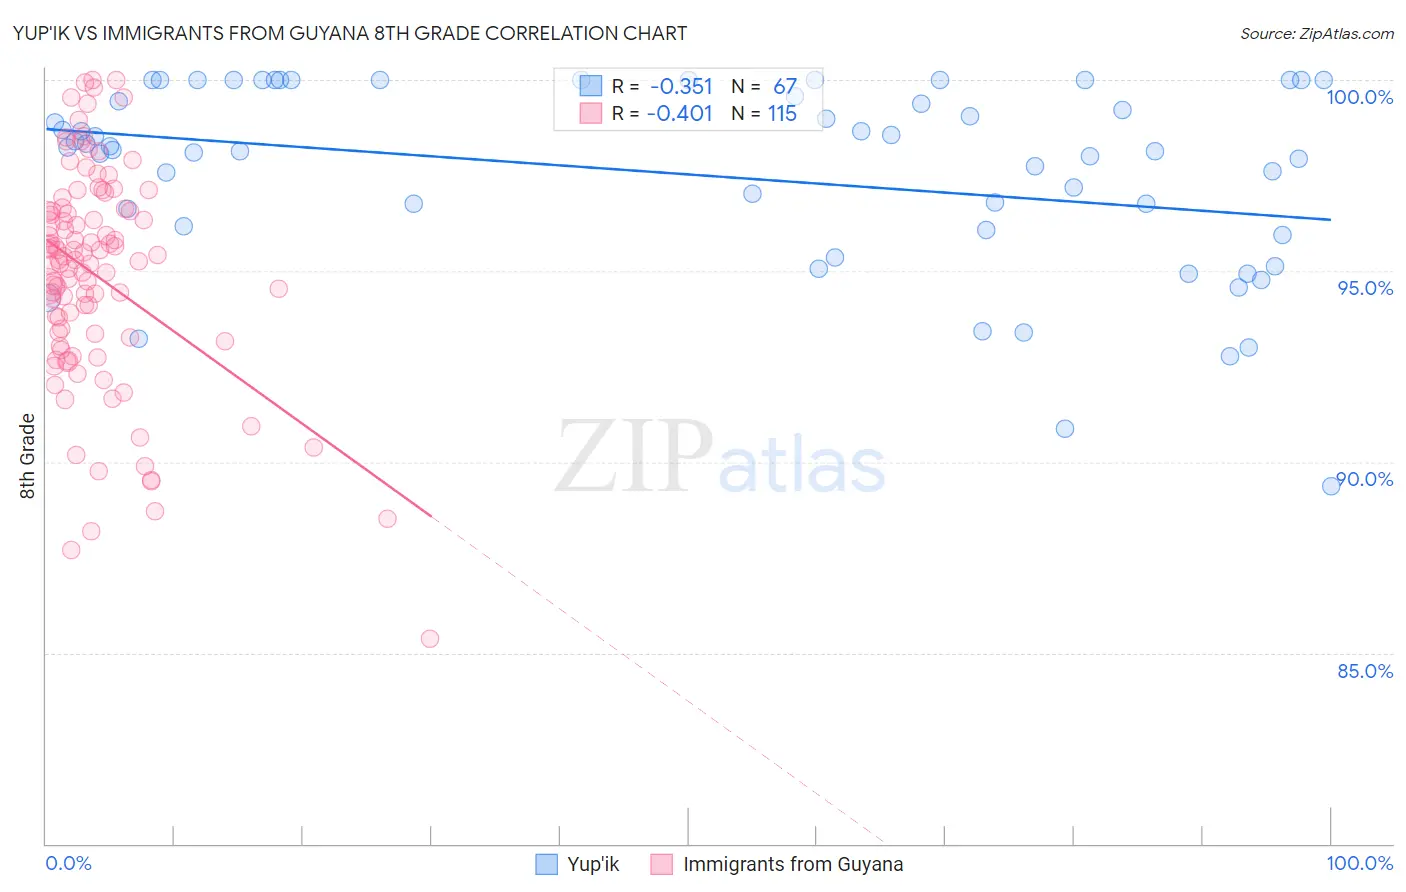
Yup'ik vs Immigrants from Guyana 8th Grade Correlation Chart
The statistical analysis conducted on geographies consisting of 39,963,824 people shows a mild negative correlation between the proportion of Yup'ik and percentage of population with at least 8th grade education in the United States with a correlation coefficient (R) of -0.351 and weighted average of 97.0%. Similarly, the statistical analysis conducted on geographies consisting of 183,673,461 people shows a moderate negative correlation between the proportion of Immigrants from Guyana and percentage of population with at least 8th grade education in the United States with a correlation coefficient (R) of -0.401 and weighted average of 93.8%, a difference of 3.5%.
8th Grade Correlation Summary
| Measurement | Yup'ik | Immigrants from Guyana |
| Minimum | 89.4% | 85.4% |
| Maximum | 100.0% | 100.0% |
| Range | 10.6% | 14.6% |
| Mean | 97.5% | 94.9% |
| Median | 98.2% | 95.3% |
| Interquartile 25% (IQ1) | 96.1% | 93.3% |
| Interquartile 75% (IQ3) | 100.0% | 96.6% |
| Interquartile Range (IQR) | 3.9% | 3.3% |
| Standard Deviation (Sample) | 2.5% | 2.9% |
| Standard Deviation (Population) | 2.5% | 2.8% |
Similar Demographics by 8th Grade
Demographics Similar to Yup'ik by 8th Grade
In terms of 8th grade, the demographic groups most similar to Yup'ik are Swiss (97.0%, a difference of 0.010%), Sioux (97.1%, a difference of 0.030%), Chippewa (97.1%, a difference of 0.030%), Luxembourger (97.0%, a difference of 0.040%), and Alaska Native (97.0%, a difference of 0.050%).
| Demographics | Rating | Rank | 8th Grade |
| Czechs | 100.0 /100 | #25 | Exceptional 97.1% |
| French | 100.0 /100 | #26 | Exceptional 97.1% |
| Scotch-Irish | 100.0 /100 | #27 | Exceptional 97.1% |
| Italians | 100.0 /100 | #28 | Exceptional 97.1% |
| Europeans | 100.0 /100 | #29 | Exceptional 97.1% |
| Sioux | 100.0 /100 | #30 | Exceptional 97.1% |
| Chippewa | 100.0 /100 | #31 | Exceptional 97.1% |
| Yup'ik | 100.0 /100 | #32 | Exceptional 97.0% |
| Swiss | 100.0 /100 | #33 | Exceptional 97.0% |
| Luxembourgers | 100.0 /100 | #34 | Exceptional 97.0% |
| Alaska Natives | 100.0 /100 | #35 | Exceptional 97.0% |
| Belgians | 100.0 /100 | #36 | Exceptional 97.0% |
| Latvians | 100.0 /100 | #37 | Exceptional 97.0% |
| British | 100.0 /100 | #38 | Exceptional 97.0% |
| Hungarians | 100.0 /100 | #39 | Exceptional 97.0% |
Demographics Similar to Immigrants from Guyana by 8th Grade
In terms of 8th grade, the demographic groups most similar to Immigrants from Guyana are Immigrants from Portugal (93.8%, a difference of 0.010%), Immigrants from Haiti (93.9%, a difference of 0.090%), Guyanese (93.9%, a difference of 0.13%), Ecuadorian (93.6%, a difference of 0.18%), and Immigrants (93.6%, a difference of 0.20%).
| Demographics | Rating | Rank | 8th Grade |
| Cubans | 0.0 /100 | #299 | Tragic 94.1% |
| Immigrants | Burma/Myanmar | 0.0 /100 | #300 | Tragic 94.1% |
| Immigrants | Laos | 0.0 /100 | #301 | Tragic 94.1% |
| Sri Lankans | 0.0 /100 | #302 | Tragic 94.0% |
| Immigrants | Dominica | 0.0 /100 | #303 | Tragic 94.0% |
| Guyanese | 0.0 /100 | #304 | Tragic 93.9% |
| Immigrants | Haiti | 0.0 /100 | #305 | Tragic 93.9% |
| Immigrants | Guyana | 0.0 /100 | #306 | Tragic 93.8% |
| Immigrants | Portugal | 0.0 /100 | #307 | Tragic 93.8% |
| Ecuadorians | 0.0 /100 | #308 | Tragic 93.6% |
| Immigrants | Immigrants | 0.0 /100 | #309 | Tragic 93.6% |
| Japanese | 0.0 /100 | #310 | Tragic 93.6% |
| Immigrants | Bangladesh | 0.0 /100 | #311 | Tragic 93.6% |
| Cape Verdeans | 0.0 /100 | #312 | Tragic 93.5% |
| Immigrants | Caribbean | 0.0 /100 | #313 | Tragic 93.5% |