Egyptian vs Immigrants from Northern Europe 8th Grade
COMPARE
Egyptian
Immigrants from Northern Europe
8th Grade
8th Grade Comparison
Egyptians
Immigrants from Northern Europe
95.8%
8TH GRADE
58.2/ 100
METRIC RATING
171st/ 347
METRIC RANK
96.7%
8TH GRADE
99.8/ 100
METRIC RATING
60th/ 347
METRIC RANK
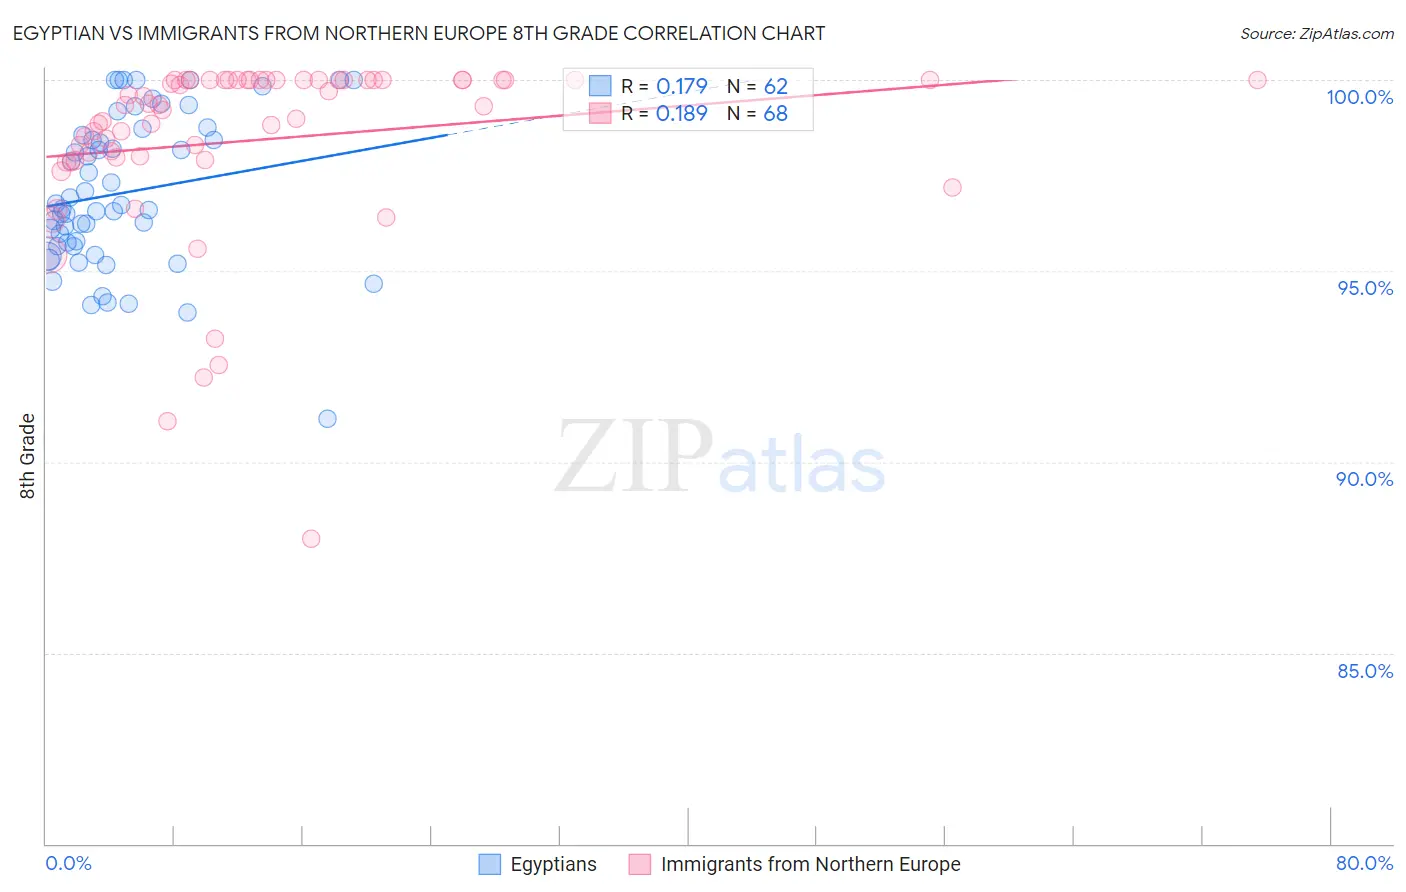
Egyptian vs Immigrants from Northern Europe 8th Grade Correlation Chart
The statistical analysis conducted on geographies consisting of 276,927,423 people shows a poor positive correlation between the proportion of Egyptians and percentage of population with at least 8th grade education in the United States with a correlation coefficient (R) of 0.179 and weighted average of 95.8%. Similarly, the statistical analysis conducted on geographies consisting of 477,226,562 people shows a poor positive correlation between the proportion of Immigrants from Northern Europe and percentage of population with at least 8th grade education in the United States with a correlation coefficient (R) of 0.189 and weighted average of 96.7%, a difference of 0.94%.
8th Grade Correlation Summary
| Measurement | Egyptian | Immigrants from Northern Europe |
| Minimum | 91.1% | 88.0% |
| Maximum | 100.0% | 100.0% |
| Range | 8.9% | 12.0% |
| Mean | 97.0% | 98.4% |
| Median | 96.7% | 99.3% |
| Interquartile 25% (IQ1) | 95.7% | 97.9% |
| Interquartile 75% (IQ3) | 98.6% | 100.0% |
| Interquartile Range (IQR) | 2.9% | 2.1% |
| Standard Deviation (Sample) | 2.0% | 2.4% |
| Standard Deviation (Population) | 2.0% | 2.4% |
Similar Demographics by 8th Grade
Demographics Similar to Egyptians by 8th Grade
In terms of 8th grade, the demographic groups most similar to Egyptians are Immigrants from Iran (95.8%, a difference of 0.0%), Ute (95.8%, a difference of 0.0%), Immigrants from Korea (95.8%, a difference of 0.0%), Spaniard (95.8%, a difference of 0.010%), and Immigrants from Ukraine (95.8%, a difference of 0.010%).
| Demographics | Rating | Rank | 8th Grade |
| Immigrants | Italy | 63.5 /100 | #164 | Good 95.8% |
| Alsatians | 61.4 /100 | #165 | Good 95.8% |
| Immigrants | Poland | 61.1 /100 | #166 | Good 95.8% |
| Spaniards | 60.0 /100 | #167 | Good 95.8% |
| Immigrants | Ukraine | 59.5 /100 | #168 | Average 95.8% |
| Immigrants | Iran | 58.6 /100 | #169 | Average 95.8% |
| Ute | 58.5 /100 | #170 | Average 95.8% |
| Egyptians | 58.2 /100 | #171 | Average 95.8% |
| Immigrants | Korea | 57.9 /100 | #172 | Average 95.8% |
| Mongolians | 53.0 /100 | #173 | Average 95.8% |
| Chileans | 50.0 /100 | #174 | Average 95.7% |
| Immigrants | Albania | 49.6 /100 | #175 | Average 95.7% |
| Pakistanis | 48.8 /100 | #176 | Average 95.7% |
| Marshallese | 47.6 /100 | #177 | Average 95.7% |
| Venezuelans | 47.5 /100 | #178 | Average 95.7% |
Demographics Similar to Immigrants from Northern Europe by 8th Grade
In terms of 8th grade, the demographic groups most similar to Immigrants from Northern Europe are Immigrants from North America (96.7%, a difference of 0.0%), Immigrants from Austria (96.7%, a difference of 0.0%), Immigrants from Canada (96.7%, a difference of 0.020%), White/Caucasian (96.7%, a difference of 0.020%), and Ukrainian (96.7%, a difference of 0.030%).
| Demographics | Rating | Rank | 8th Grade |
| Austrians | 99.9 /100 | #53 | Exceptional 96.7% |
| Serbians | 99.8 /100 | #54 | Exceptional 96.7% |
| Russians | 99.8 /100 | #55 | Exceptional 96.7% |
| Australians | 99.8 /100 | #56 | Exceptional 96.7% |
| Macedonians | 99.8 /100 | #57 | Exceptional 96.7% |
| Immigrants | Canada | 99.8 /100 | #58 | Exceptional 96.7% |
| Immigrants | North America | 99.8 /100 | #59 | Exceptional 96.7% |
| Immigrants | Northern Europe | 99.8 /100 | #60 | Exceptional 96.7% |
| Immigrants | Austria | 99.8 /100 | #61 | Exceptional 96.7% |
| Whites/Caucasians | 99.8 /100 | #62 | Exceptional 96.7% |
| Ukrainians | 99.7 /100 | #63 | Exceptional 96.7% |
| Immigrants | India | 99.7 /100 | #64 | Exceptional 96.6% |
| Native Hawaiians | 99.7 /100 | #65 | Exceptional 96.6% |
| Canadians | 99.7 /100 | #66 | Exceptional 96.6% |
| Iranians | 99.7 /100 | #67 | Exceptional 96.6% |