Okinawan vs Immigrants from Guyana 8th Grade
COMPARE
Okinawan
Immigrants from Guyana
8th Grade
8th Grade Comparison
Okinawans
Immigrants from Guyana
96.3%
8TH GRADE
98.0/ 100
METRIC RATING
106th/ 347
METRIC RANK
93.8%
8TH GRADE
0.0/ 100
METRIC RATING
306th/ 347
METRIC RANK
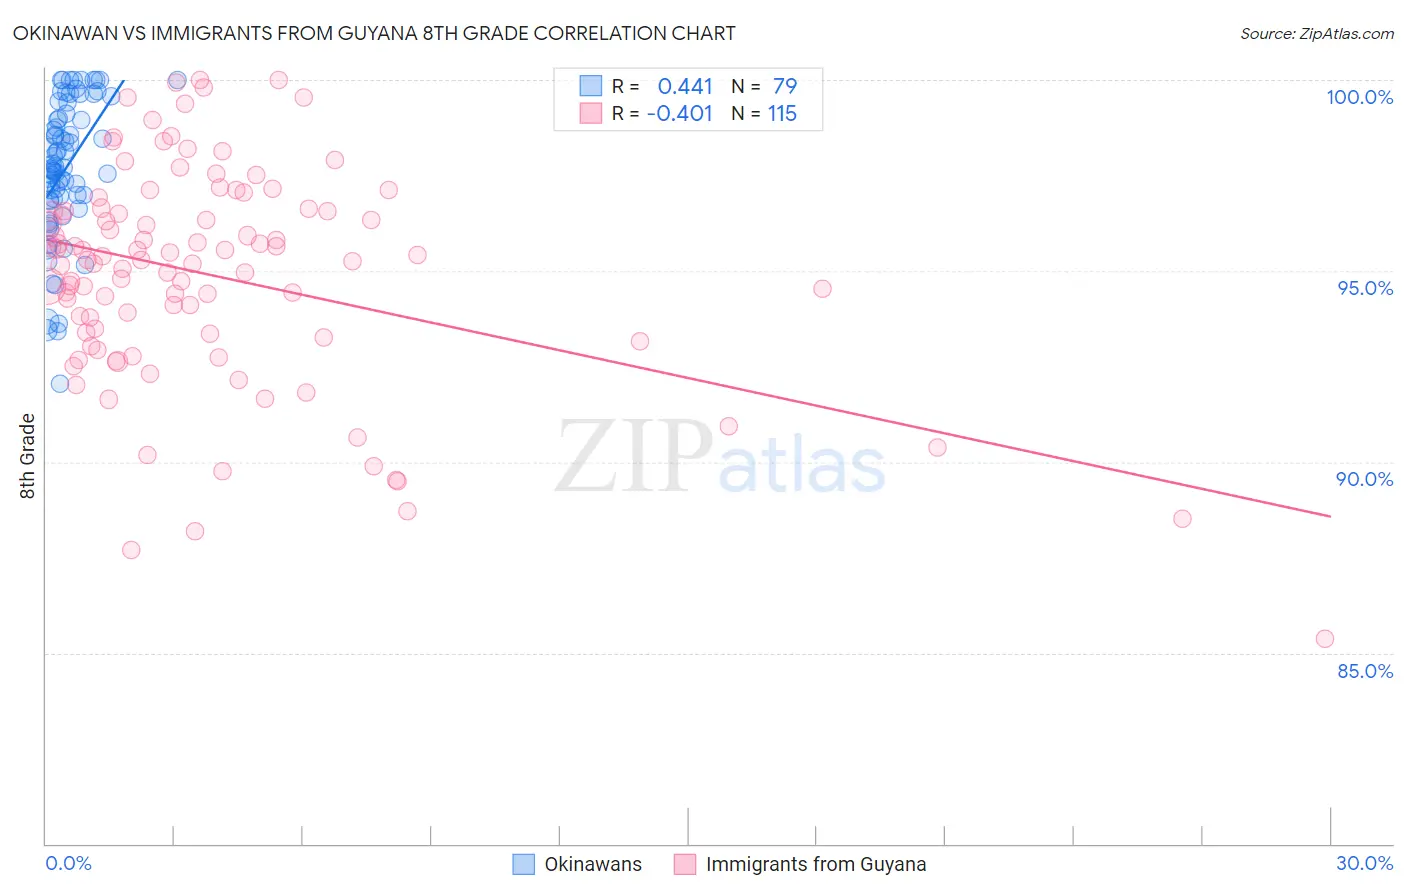
Okinawan vs Immigrants from Guyana 8th Grade Correlation Chart
The statistical analysis conducted on geographies consisting of 73,779,368 people shows a moderate positive correlation between the proportion of Okinawans and percentage of population with at least 8th grade education in the United States with a correlation coefficient (R) of 0.441 and weighted average of 96.3%. Similarly, the statistical analysis conducted on geographies consisting of 183,673,461 people shows a moderate negative correlation between the proportion of Immigrants from Guyana and percentage of population with at least 8th grade education in the United States with a correlation coefficient (R) of -0.401 and weighted average of 93.8%, a difference of 2.7%.
8th Grade Correlation Summary
| Measurement | Okinawan | Immigrants from Guyana |
| Minimum | 92.0% | 85.4% |
| Maximum | 100.0% | 100.0% |
| Range | 8.0% | 14.6% |
| Mean | 97.7% | 94.9% |
| Median | 97.7% | 95.3% |
| Interquartile 25% (IQ1) | 96.9% | 93.3% |
| Interquartile 75% (IQ3) | 99.1% | 96.6% |
| Interquartile Range (IQR) | 2.2% | 3.3% |
| Standard Deviation (Sample) | 1.8% | 2.9% |
| Standard Deviation (Population) | 1.8% | 2.8% |
Similar Demographics by 8th Grade
Demographics Similar to Okinawans by 8th Grade
In terms of 8th grade, the demographic groups most similar to Okinawans are Immigrants from Saudi Arabia (96.3%, a difference of 0.0%), Kiowa (96.3%, a difference of 0.0%), Immigrants from North Macedonia (96.3%, a difference of 0.0%), Immigrants from Latvia (96.3%, a difference of 0.010%), and Bhutanese (96.4%, a difference of 0.020%).
| Demographics | Rating | Rank | 8th Grade |
| Cree | 98.6 /100 | #99 | Exceptional 96.4% |
| Immigrants | Czechoslovakia | 98.6 /100 | #100 | Exceptional 96.4% |
| Bhutanese | 98.2 /100 | #101 | Exceptional 96.4% |
| South Africans | 98.2 /100 | #102 | Exceptional 96.4% |
| Immigrants | Saudi Arabia | 98.0 /100 | #103 | Exceptional 96.3% |
| Kiowa | 98.0 /100 | #104 | Exceptional 96.3% |
| Immigrants | North Macedonia | 98.0 /100 | #105 | Exceptional 96.3% |
| Okinawans | 98.0 /100 | #106 | Exceptional 96.3% |
| Immigrants | Latvia | 97.8 /100 | #107 | Exceptional 96.3% |
| Lebanese | 97.5 /100 | #108 | Exceptional 96.3% |
| Iroquois | 97.5 /100 | #109 | Exceptional 96.3% |
| Cajuns | 97.1 /100 | #110 | Exceptional 96.3% |
| Shoshone | 96.8 /100 | #111 | Exceptional 96.3% |
| Syrians | 96.7 /100 | #112 | Exceptional 96.3% |
| Immigrants | Zimbabwe | 96.7 /100 | #113 | Exceptional 96.3% |
Demographics Similar to Immigrants from Guyana by 8th Grade
In terms of 8th grade, the demographic groups most similar to Immigrants from Guyana are Immigrants from Portugal (93.8%, a difference of 0.010%), Immigrants from Haiti (93.9%, a difference of 0.090%), Guyanese (93.9%, a difference of 0.13%), Ecuadorian (93.6%, a difference of 0.18%), and Immigrants (93.6%, a difference of 0.20%).
| Demographics | Rating | Rank | 8th Grade |
| Cubans | 0.0 /100 | #299 | Tragic 94.1% |
| Immigrants | Burma/Myanmar | 0.0 /100 | #300 | Tragic 94.1% |
| Immigrants | Laos | 0.0 /100 | #301 | Tragic 94.1% |
| Sri Lankans | 0.0 /100 | #302 | Tragic 94.0% |
| Immigrants | Dominica | 0.0 /100 | #303 | Tragic 94.0% |
| Guyanese | 0.0 /100 | #304 | Tragic 93.9% |
| Immigrants | Haiti | 0.0 /100 | #305 | Tragic 93.9% |
| Immigrants | Guyana | 0.0 /100 | #306 | Tragic 93.8% |
| Immigrants | Portugal | 0.0 /100 | #307 | Tragic 93.8% |
| Ecuadorians | 0.0 /100 | #308 | Tragic 93.6% |
| Immigrants | Immigrants | 0.0 /100 | #309 | Tragic 93.6% |
| Japanese | 0.0 /100 | #310 | Tragic 93.6% |
| Immigrants | Bangladesh | 0.0 /100 | #311 | Tragic 93.6% |
| Cape Verdeans | 0.0 /100 | #312 | Tragic 93.5% |
| Immigrants | Caribbean | 0.0 /100 | #313 | Tragic 93.5% |