Immigrants from Argentina vs Immigrants from Guyana 8th Grade
COMPARE
Immigrants from Argentina
Immigrants from Guyana
8th Grade
8th Grade Comparison
Immigrants from Argentina
Immigrants from Guyana
95.5%
8TH GRADE
20.6/ 100
METRIC RATING
201st/ 347
METRIC RANK
93.8%
8TH GRADE
0.0/ 100
METRIC RATING
306th/ 347
METRIC RANK
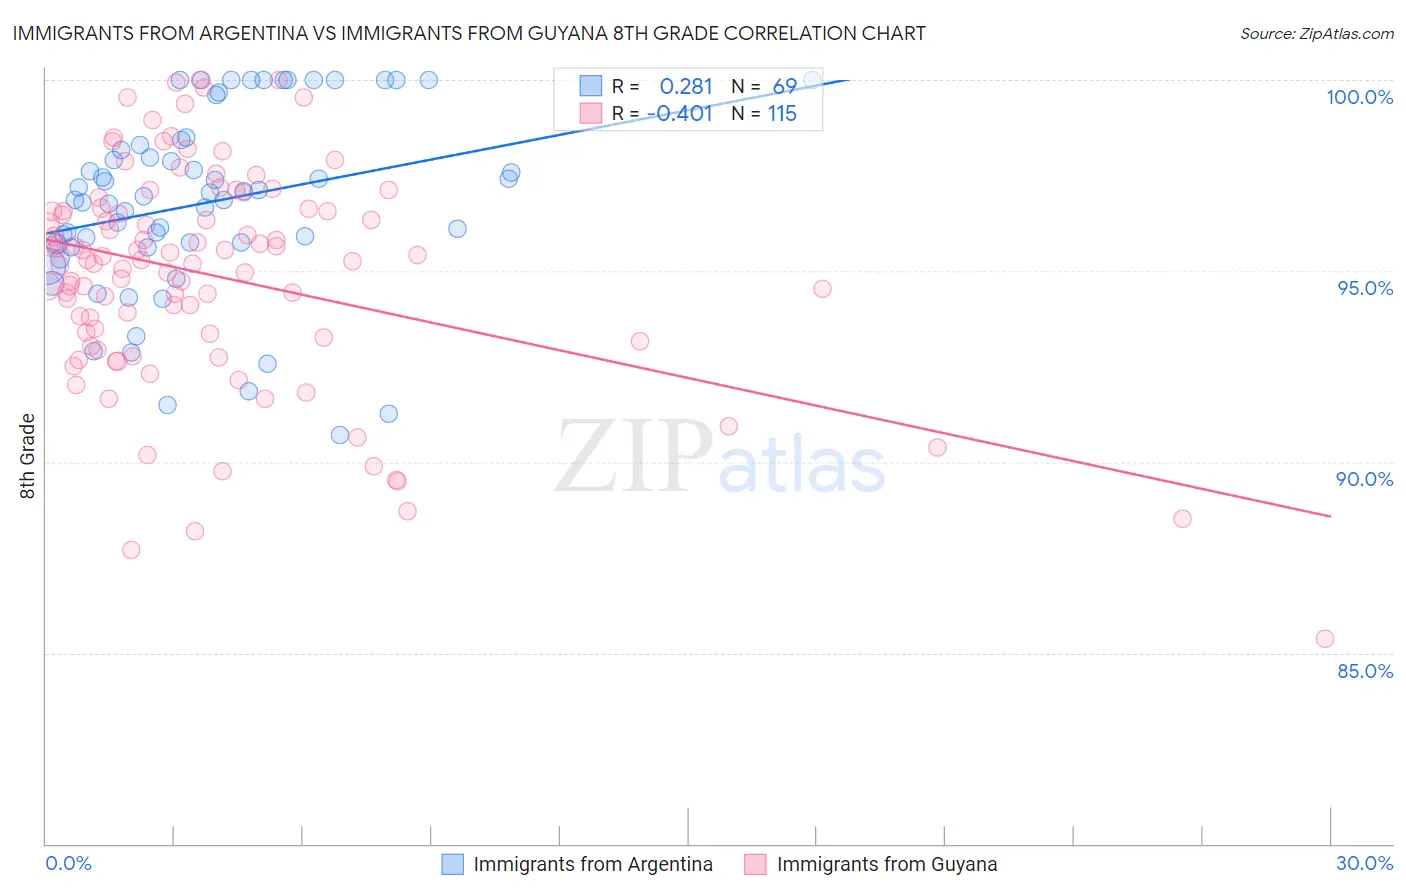
Immigrants from Argentina vs Immigrants from Guyana 8th Grade Correlation Chart
The statistical analysis conducted on geographies consisting of 264,437,906 people shows a weak positive correlation between the proportion of Immigrants from Argentina and percentage of population with at least 8th grade education in the United States with a correlation coefficient (R) of 0.281 and weighted average of 95.5%. Similarly, the statistical analysis conducted on geographies consisting of 183,673,461 people shows a moderate negative correlation between the proportion of Immigrants from Guyana and percentage of population with at least 8th grade education in the United States with a correlation coefficient (R) of -0.401 and weighted average of 93.8%, a difference of 1.9%.
8th Grade Correlation Summary
| Measurement | Immigrants from Argentina | Immigrants from Guyana |
| Minimum | 90.7% | 85.4% |
| Maximum | 100.0% | 100.0% |
| Range | 9.3% | 14.6% |
| Mean | 96.8% | 94.9% |
| Median | 97.0% | 95.3% |
| Interquartile 25% (IQ1) | 95.7% | 93.3% |
| Interquartile 75% (IQ3) | 98.4% | 96.6% |
| Interquartile Range (IQR) | 2.7% | 3.3% |
| Standard Deviation (Sample) | 2.4% | 2.9% |
| Standard Deviation (Population) | 2.4% | 2.8% |
Similar Demographics by 8th Grade
Demographics Similar to Immigrants from Argentina by 8th Grade
In terms of 8th grade, the demographic groups most similar to Immigrants from Argentina are Apache (95.5%, a difference of 0.010%), Paraguayan (95.5%, a difference of 0.020%), Immigrants from Northern Africa (95.5%, a difference of 0.020%), Argentinean (95.5%, a difference of 0.020%), and Sierra Leonean (95.6%, a difference of 0.030%).
| Demographics | Rating | Rank | 8th Grade |
| Guamanians/Chamorros | 26.6 /100 | #194 | Fair 95.6% |
| Immigrants | Zaire | 25.2 /100 | #195 | Fair 95.6% |
| Assyrians/Chaldeans/Syriacs | 24.5 /100 | #196 | Fair 95.6% |
| Sierra Leoneans | 24.3 /100 | #197 | Fair 95.6% |
| Paraguayans | 22.6 /100 | #198 | Fair 95.5% |
| Immigrants | Northern Africa | 22.5 /100 | #199 | Fair 95.5% |
| Argentineans | 22.2 /100 | #200 | Fair 95.5% |
| Immigrants | Argentina | 20.6 /100 | #201 | Fair 95.5% |
| Apache | 19.4 /100 | #202 | Poor 95.5% |
| Moroccans | 17.4 /100 | #203 | Poor 95.5% |
| Hawaiians | 16.7 /100 | #204 | Poor 95.5% |
| Immigrants | Bahamas | 16.7 /100 | #205 | Poor 95.5% |
| Comanche | 16.3 /100 | #206 | Poor 95.5% |
| Immigrants | Sudan | 15.1 /100 | #207 | Poor 95.5% |
| Portuguese | 14.3 /100 | #208 | Poor 95.5% |
Demographics Similar to Immigrants from Guyana by 8th Grade
In terms of 8th grade, the demographic groups most similar to Immigrants from Guyana are Immigrants from Portugal (93.8%, a difference of 0.010%), Immigrants from Haiti (93.9%, a difference of 0.090%), Guyanese (93.9%, a difference of 0.13%), Ecuadorian (93.6%, a difference of 0.18%), and Immigrants (93.6%, a difference of 0.20%).
| Demographics | Rating | Rank | 8th Grade |
| Cubans | 0.0 /100 | #299 | Tragic 94.1% |
| Immigrants | Burma/Myanmar | 0.0 /100 | #300 | Tragic 94.1% |
| Immigrants | Laos | 0.0 /100 | #301 | Tragic 94.1% |
| Sri Lankans | 0.0 /100 | #302 | Tragic 94.0% |
| Immigrants | Dominica | 0.0 /100 | #303 | Tragic 94.0% |
| Guyanese | 0.0 /100 | #304 | Tragic 93.9% |
| Immigrants | Haiti | 0.0 /100 | #305 | Tragic 93.9% |
| Immigrants | Guyana | 0.0 /100 | #306 | Tragic 93.8% |
| Immigrants | Portugal | 0.0 /100 | #307 | Tragic 93.8% |
| Ecuadorians | 0.0 /100 | #308 | Tragic 93.6% |
| Immigrants | Immigrants | 0.0 /100 | #309 | Tragic 93.6% |
| Japanese | 0.0 /100 | #310 | Tragic 93.6% |
| Immigrants | Bangladesh | 0.0 /100 | #311 | Tragic 93.6% |
| Cape Verdeans | 0.0 /100 | #312 | Tragic 93.5% |
| Immigrants | Caribbean | 0.0 /100 | #313 | Tragic 93.5% |