Seminole vs Creek 7th Grade
COMPARE
Seminole
Creek
7th Grade
7th Grade Comparison
Seminole
Creek
96.2%
7TH GRADE
78.1/ 100
METRIC RATING
153rd/ 347
METRIC RANK
96.9%
7TH GRADE
99.8/ 100
METRIC RATING
61st/ 347
METRIC RANK
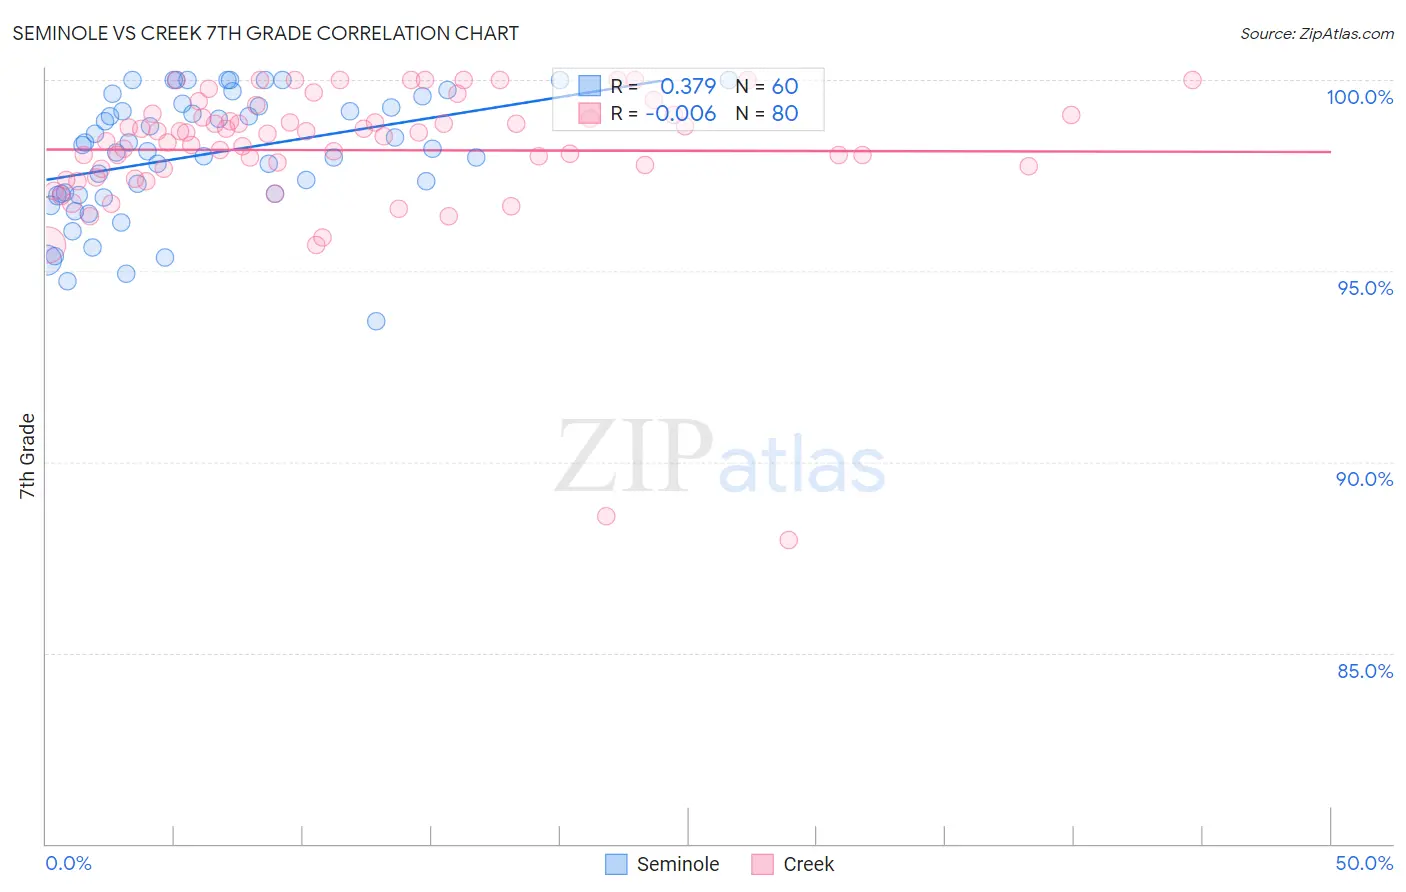
Seminole vs Creek 7th Grade Correlation Chart
The statistical analysis conducted on geographies consisting of 118,314,162 people shows a mild positive correlation between the proportion of Seminole and percentage of population with at least 7th grade education in the United States with a correlation coefficient (R) of 0.379 and weighted average of 96.2%. Similarly, the statistical analysis conducted on geographies consisting of 178,480,629 people shows no correlation between the proportion of Creek and percentage of population with at least 7th grade education in the United States with a correlation coefficient (R) of -0.006 and weighted average of 96.9%, a difference of 0.74%.
7th Grade Correlation Summary
| Measurement | Seminole | Creek |
| Minimum | 93.7% | 88.0% |
| Maximum | 100.0% | 100.0% |
| Range | 6.3% | 12.0% |
| Mean | 98.1% | 98.2% |
| Median | 98.3% | 98.6% |
| Interquartile 25% (IQ1) | 97.0% | 97.7% |
| Interquartile 75% (IQ3) | 99.4% | 99.1% |
| Interquartile Range (IQR) | 2.4% | 1.4% |
| Standard Deviation (Sample) | 1.6% | 1.9% |
| Standard Deviation (Population) | 1.6% | 1.9% |
Similar Demographics by 7th Grade
Demographics Similar to Seminole by 7th Grade
In terms of 7th grade, the demographic groups most similar to Seminole are Immigrants from Russia (96.2%, a difference of 0.0%), Immigrants from Israel (96.2%, a difference of 0.0%), Immigrants from Jordan (96.2%, a difference of 0.010%), Kenyan (96.2%, a difference of 0.020%), and Ugandan (96.2%, a difference of 0.020%).
| Demographics | Rating | Rank | 7th Grade |
| Immigrants | Eastern Europe | 83.7 /100 | #146 | Excellent 96.3% |
| French American Indians | 83.1 /100 | #147 | Excellent 96.3% |
| Israelis | 82.8 /100 | #148 | Excellent 96.3% |
| Albanians | 82.6 /100 | #149 | Excellent 96.3% |
| Immigrants | Belarus | 82.4 /100 | #150 | Excellent 96.3% |
| Hopi | 81.6 /100 | #151 | Excellent 96.3% |
| Immigrants | Russia | 78.4 /100 | #152 | Good 96.2% |
| Seminole | 78.1 /100 | #153 | Good 96.2% |
| Immigrants | Israel | 77.6 /100 | #154 | Good 96.2% |
| Immigrants | Jordan | 77.0 /100 | #155 | Good 96.2% |
| Kenyans | 76.2 /100 | #156 | Good 96.2% |
| Ugandans | 75.5 /100 | #157 | Good 96.2% |
| Arabs | 68.6 /100 | #158 | Good 96.2% |
| Alsatians | 67.2 /100 | #159 | Good 96.1% |
| Immigrants | Kenya | 66.8 /100 | #160 | Good 96.1% |
Demographics Similar to Creek by 7th Grade
In terms of 7th grade, the demographic groups most similar to Creek are Immigrants from Canada (96.9%, a difference of 0.0%), White/Caucasian (97.0%, a difference of 0.010%), Macedonian (97.0%, a difference of 0.010%), Immigrants from North America (96.9%, a difference of 0.010%), and Immigrants from Northern Europe (96.9%, a difference of 0.020%).
| Demographics | Rating | Rank | 7th Grade |
| Australians | 99.8 /100 | #54 | Exceptional 97.0% |
| Russians | 99.8 /100 | #55 | Exceptional 97.0% |
| Serbians | 99.8 /100 | #56 | Exceptional 97.0% |
| Americans | 99.8 /100 | #57 | Exceptional 97.0% |
| Whites/Caucasians | 99.8 /100 | #58 | Exceptional 97.0% |
| Macedonians | 99.8 /100 | #59 | Exceptional 97.0% |
| Immigrants | Canada | 99.8 /100 | #60 | Exceptional 96.9% |
| Creek | 99.8 /100 | #61 | Exceptional 96.9% |
| Immigrants | North America | 99.8 /100 | #62 | Exceptional 96.9% |
| Immigrants | Northern Europe | 99.7 /100 | #63 | Exceptional 96.9% |
| Immigrants | Austria | 99.7 /100 | #64 | Exceptional 96.9% |
| Canadians | 99.7 /100 | #65 | Exceptional 96.9% |
| Ukrainians | 99.7 /100 | #66 | Exceptional 96.9% |
| Native Hawaiians | 99.7 /100 | #67 | Exceptional 96.9% |
| Immigrants | India | 99.6 /100 | #68 | Exceptional 96.9% |