Immigrants from Afghanistan vs Cypriot 1st Grade
COMPARE
Immigrants from Afghanistan
Cypriot
1st Grade
1st Grade Comparison
Immigrants from Afghanistan
Cypriots
97.3%
1ST GRADE
0.0/ 100
METRIC RATING
289th/ 347
METRIC RANK
98.2%
1ST GRADE
98.3/ 100
METRIC RATING
96th/ 347
METRIC RANK
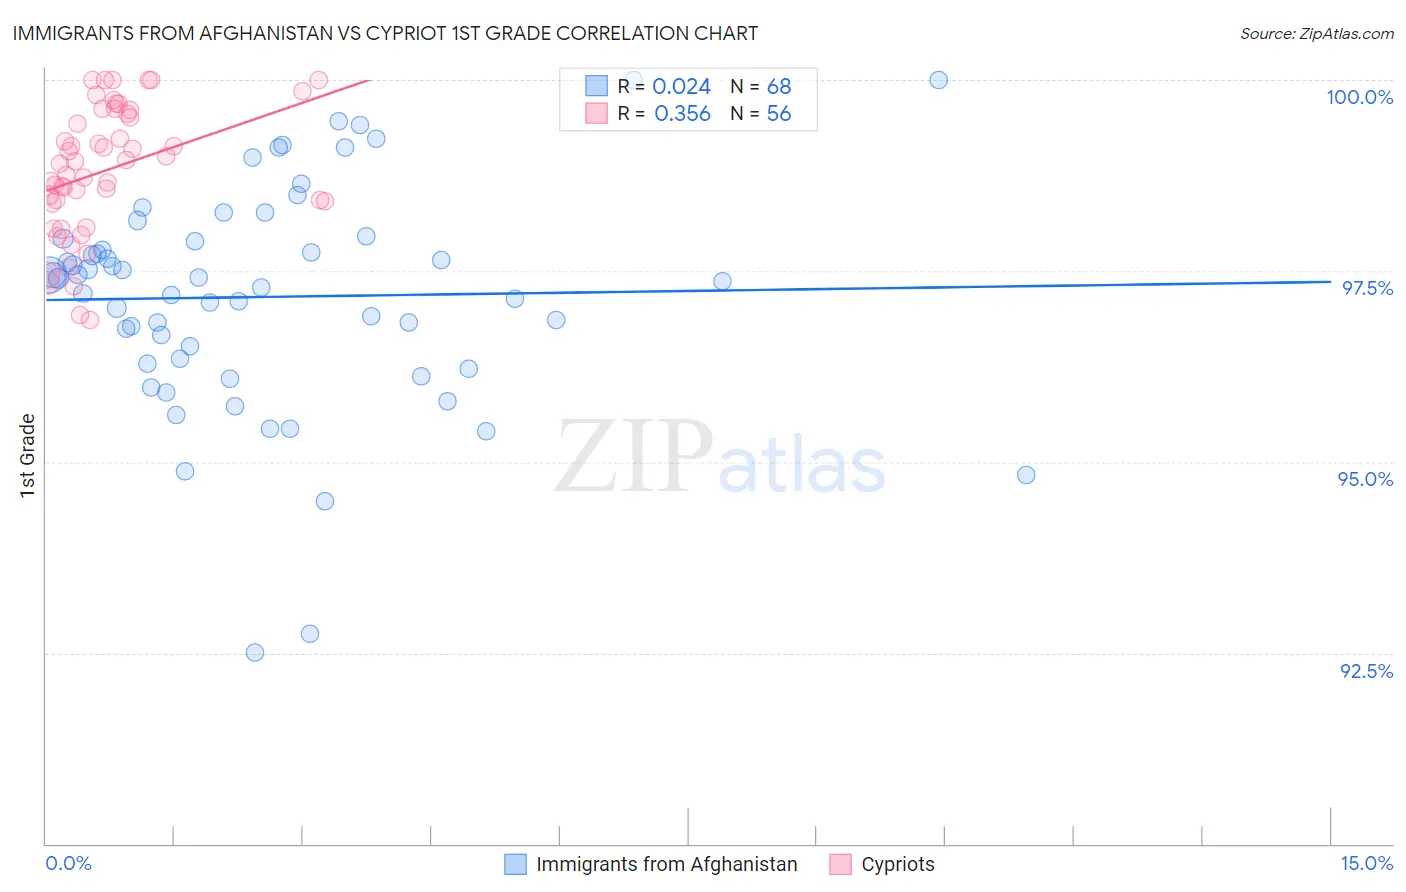
Immigrants from Afghanistan vs Cypriot 1st Grade Correlation Chart
The statistical analysis conducted on geographies consisting of 147,629,924 people shows no correlation between the proportion of Immigrants from Afghanistan and percentage of population with at least 1st grade education in the United States with a correlation coefficient (R) of 0.024 and weighted average of 97.3%. Similarly, the statistical analysis conducted on geographies consisting of 61,867,249 people shows a mild positive correlation between the proportion of Cypriots and percentage of population with at least 1st grade education in the United States with a correlation coefficient (R) of 0.356 and weighted average of 98.2%, a difference of 1.0%.
1st Grade Correlation Summary
| Measurement | Immigrants from Afghanistan | Cypriot |
| Minimum | 92.5% | 96.9% |
| Maximum | 100.0% | 100.0% |
| Range | 7.5% | 3.1% |
| Mean | 97.2% | 98.8% |
| Median | 97.4% | 98.9% |
| Interquartile 25% (IQ1) | 96.3% | 98.4% |
| Interquartile 75% (IQ3) | 97.9% | 99.6% |
| Interquartile Range (IQR) | 1.6% | 1.2% |
| Standard Deviation (Sample) | 1.5% | 0.84% |
| Standard Deviation (Population) | 1.4% | 0.83% |
Similar Demographics by 1st Grade
Demographics Similar to Immigrants from Afghanistan by 1st Grade
In terms of 1st grade, the demographic groups most similar to Immigrants from Afghanistan are Immigrants from St. Vincent and the Grenadines (97.3%, a difference of 0.0%), Immigrants from Hong Kong (97.3%, a difference of 0.020%), Immigrants from Thailand (97.3%, a difference of 0.020%), Houma (97.2%, a difference of 0.020%), and Immigrants from Barbados (97.3%, a difference of 0.030%).
| Demographics | Rating | Rank | 1st Grade |
| Barbadians | 0.1 /100 | #282 | Tragic 97.3% |
| Immigrants | West Indies | 0.0 /100 | #283 | Tragic 97.3% |
| Immigrants | Trinidad and Tobago | 0.0 /100 | #284 | Tragic 97.3% |
| Immigrants | Portugal | 0.0 /100 | #285 | Tragic 97.3% |
| Immigrants | Barbados | 0.0 /100 | #286 | Tragic 97.3% |
| Immigrants | Hong Kong | 0.0 /100 | #287 | Tragic 97.3% |
| Immigrants | Thailand | 0.0 /100 | #288 | Tragic 97.3% |
| Immigrants | Afghanistan | 0.0 /100 | #289 | Tragic 97.3% |
| Immigrants | St. Vincent and the Grenadines | 0.0 /100 | #290 | Tragic 97.3% |
| Houma | 0.0 /100 | #291 | Tragic 97.2% |
| British West Indians | 0.0 /100 | #292 | Tragic 97.2% |
| Malaysians | 0.0 /100 | #293 | Tragic 97.2% |
| Immigrants | Grenada | 0.0 /100 | #294 | Tragic 97.2% |
| Immigrants | Immigrants | 0.0 /100 | #295 | Tragic 97.2% |
| Immigrants | Eritrea | 0.0 /100 | #296 | Tragic 97.2% |
Demographics Similar to Cypriots by 1st Grade
In terms of 1st grade, the demographic groups most similar to Cypriots are Nonimmigrants (98.2%, a difference of 0.0%), Choctaw (98.2%, a difference of 0.0%), Puget Sound Salish (98.2%, a difference of 0.0%), Immigrants from India (98.2%, a difference of 0.010%), and South African (98.2%, a difference of 0.010%).
| Demographics | Rating | Rank | 1st Grade |
| Immigrants | South Africa | 98.8 /100 | #89 | Exceptional 98.3% |
| Ukrainians | 98.8 /100 | #90 | Exceptional 98.3% |
| Immigrants | Western Europe | 98.8 /100 | #91 | Exceptional 98.3% |
| Macedonians | 98.7 /100 | #92 | Exceptional 98.3% |
| Immigrants | India | 98.6 /100 | #93 | Exceptional 98.2% |
| South Africans | 98.6 /100 | #94 | Exceptional 98.2% |
| Immigrants | Germany | 98.5 /100 | #95 | Exceptional 98.2% |
| Cypriots | 98.3 /100 | #96 | Exceptional 98.2% |
| Immigrants | Nonimmigrants | 98.3 /100 | #97 | Exceptional 98.2% |
| Choctaw | 98.3 /100 | #98 | Exceptional 98.2% |
| Puget Sound Salish | 98.2 /100 | #99 | Exceptional 98.2% |
| Colville | 98.0 /100 | #100 | Exceptional 98.2% |
| Romanians | 97.8 /100 | #101 | Exceptional 98.2% |
| Cree | 97.8 /100 | #102 | Exceptional 98.2% |
| Immigrants | Ireland | 97.7 /100 | #103 | Exceptional 98.2% |