Yugoslavian vs Argentinean Unemployment Among Ages 60 to 64 years
COMPARE
Yugoslavian
Argentinean
Unemployment Among Ages 60 to 64 years
Unemployment Among Ages 60 to 64 years Comparison
Yugoslavians
Argentineans
4.4%
UNEMPLOYMENT AMONG AGES 60 TO 64 YEARS
100.0/ 100
METRIC RATING
25th/ 347
METRIC RANK
5.0%
UNEMPLOYMENT AMONG AGES 60 TO 64 YEARS
2.1/ 100
METRIC RATING
242nd/ 347
METRIC RANK
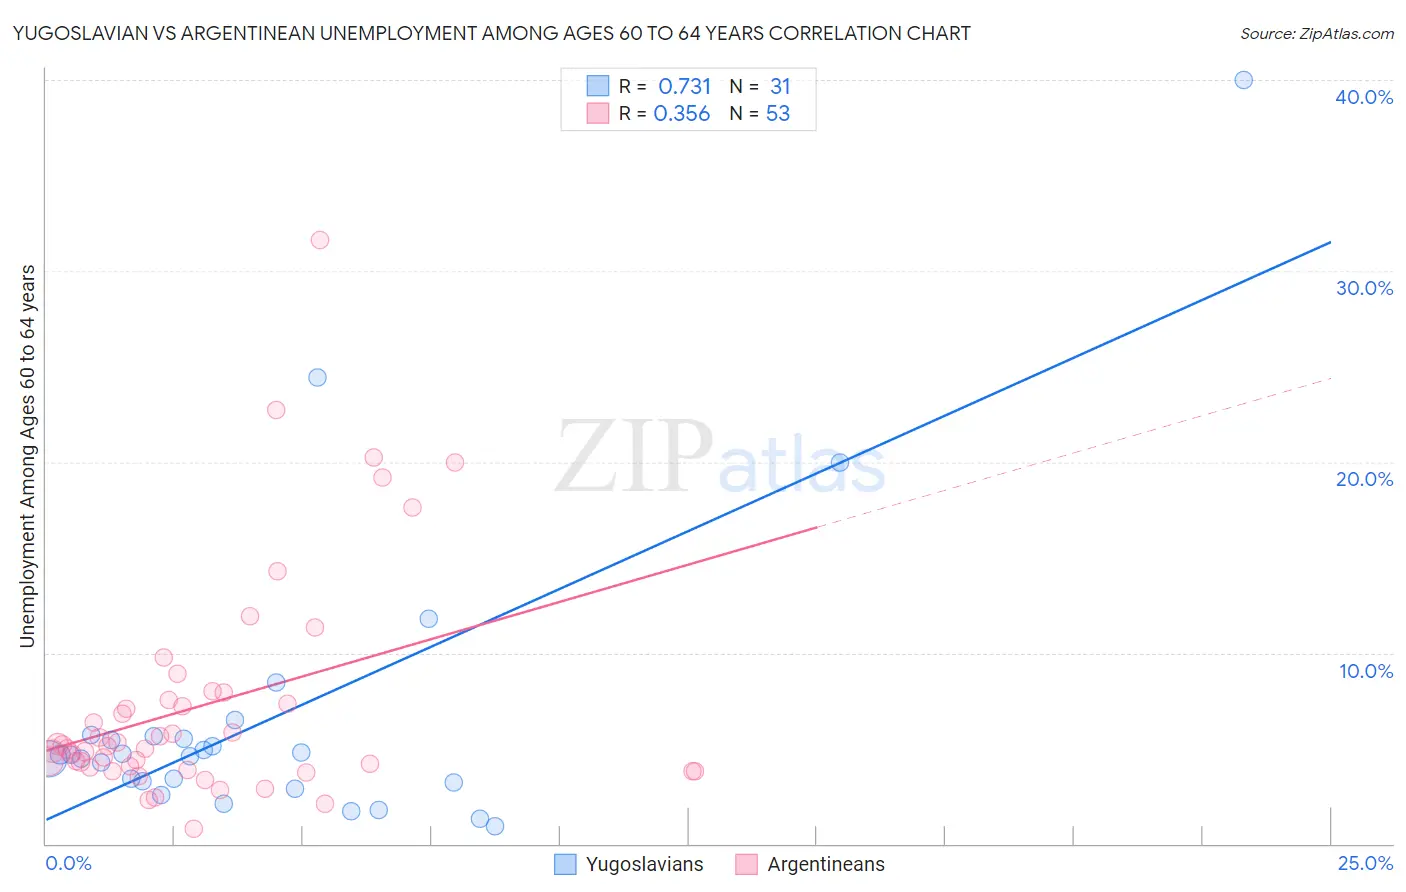
Yugoslavian vs Argentinean Unemployment Among Ages 60 to 64 years Correlation Chart
The statistical analysis conducted on geographies consisting of 264,484,480 people shows a strong positive correlation between the proportion of Yugoslavians and unemployment rate among population between the ages 60 and 64 in the United States with a correlation coefficient (R) of 0.731 and weighted average of 4.4%. Similarly, the statistical analysis conducted on geographies consisting of 279,615,026 people shows a mild positive correlation between the proportion of Argentineans and unemployment rate among population between the ages 60 and 64 in the United States with a correlation coefficient (R) of 0.356 and weighted average of 5.0%, a difference of 13.0%.
Unemployment Among Ages 60 to 64 years Correlation Summary
| Measurement | Yugoslavian | Argentinean |
| Minimum | 0.90% | 0.80% |
| Maximum | 40.0% | 31.6% |
| Range | 39.1% | 30.8% |
| Mean | 6.7% | 7.3% |
| Median | 4.7% | 5.1% |
| Interquartile 25% (IQ1) | 3.2% | 4.0% |
| Interquartile 75% (IQ3) | 5.6% | 7.7% |
| Interquartile Range (IQR) | 2.4% | 3.8% |
| Standard Deviation (Sample) | 7.9% | 6.0% |
| Standard Deviation (Population) | 7.8% | 6.0% |
Similar Demographics by Unemployment Among Ages 60 to 64 years
Demographics Similar to Yugoslavians by Unemployment Among Ages 60 to 64 years
In terms of unemployment among ages 60 to 64 years, the demographic groups most similar to Yugoslavians are Czech (4.4%, a difference of 0.10%), Immigrants from Iraq (4.5%, a difference of 0.18%), Immigrants from Nepal (4.5%, a difference of 0.26%), Cuban (4.5%, a difference of 0.49%), and Immigrants from Venezuela (4.5%, a difference of 0.51%).
| Demographics | Rating | Rank | Unemployment Among Ages 60 to 64 years |
| Slovenes | 100.0 /100 | #18 | Exceptional 4.4% |
| Tsimshian | 100.0 /100 | #19 | Exceptional 4.4% |
| Afghans | 100.0 /100 | #20 | Exceptional 4.4% |
| Immigrants | Cabo Verde | 100.0 /100 | #21 | Exceptional 4.4% |
| Cape Verdeans | 100.0 /100 | #22 | Exceptional 4.4% |
| Immigrants | Zaire | 100.0 /100 | #23 | Exceptional 4.4% |
| Immigrants | Burma/Myanmar | 100.0 /100 | #24 | Exceptional 4.4% |
| Yugoslavians | 100.0 /100 | #25 | Exceptional 4.4% |
| Czechs | 100.0 /100 | #26 | Exceptional 4.4% |
| Immigrants | Iraq | 100.0 /100 | #27 | Exceptional 4.5% |
| Immigrants | Nepal | 100.0 /100 | #28 | Exceptional 4.5% |
| Cubans | 100.0 /100 | #29 | Exceptional 4.5% |
| Immigrants | Venezuela | 100.0 /100 | #30 | Exceptional 4.5% |
| Immigrants | Eritrea | 100.0 /100 | #31 | Exceptional 4.5% |
| Zimbabweans | 100.0 /100 | #32 | Exceptional 4.5% |
Demographics Similar to Argentineans by Unemployment Among Ages 60 to 64 years
In terms of unemployment among ages 60 to 64 years, the demographic groups most similar to Argentineans are Immigrants from Croatia (5.0%, a difference of 0.050%), Indian (Asian) (5.0%, a difference of 0.050%), Immigrants from Philippines (5.0%, a difference of 0.10%), Ghanaian (5.0%, a difference of 0.13%), and Peruvian (5.0%, a difference of 0.22%).
| Demographics | Rating | Rank | Unemployment Among Ages 60 to 64 years |
| Delaware | 3.6 /100 | #235 | Tragic 5.0% |
| Immigrants | Sierra Leone | 3.1 /100 | #236 | Tragic 5.0% |
| Immigrants | Western Asia | 3.0 /100 | #237 | Tragic 5.0% |
| Immigrants | Poland | 3.0 /100 | #238 | Tragic 5.0% |
| Ghanaians | 2.4 /100 | #239 | Tragic 5.0% |
| Immigrants | Croatia | 2.2 /100 | #240 | Tragic 5.0% |
| Indians (Asian) | 2.2 /100 | #241 | Tragic 5.0% |
| Argentineans | 2.1 /100 | #242 | Tragic 5.0% |
| Immigrants | Philippines | 1.9 /100 | #243 | Tragic 5.0% |
| Peruvians | 1.6 /100 | #244 | Tragic 5.0% |
| Comanche | 1.3 /100 | #245 | Tragic 5.0% |
| Immigrants | South America | 1.1 /100 | #246 | Tragic 5.0% |
| Immigrants | North Macedonia | 1.1 /100 | #247 | Tragic 5.0% |
| Immigrants | Fiji | 1.1 /100 | #248 | Tragic 5.1% |
| South Americans | 1.0 /100 | #249 | Tragic 5.1% |