Immigrants from Lithuania vs Italian Bachelor's Degree
COMPARE
Immigrants from Lithuania
Italian
Bachelor's Degree
Bachelor's Degree Comparison
Immigrants from Lithuania
Italians
44.6%
BACHELOR'S DEGREE
99.9/ 100
METRIC RATING
44th/ 347
METRIC RANK
40.1%
BACHELOR'S DEGREE
91.9/ 100
METRIC RATING
131st/ 347
METRIC RANK
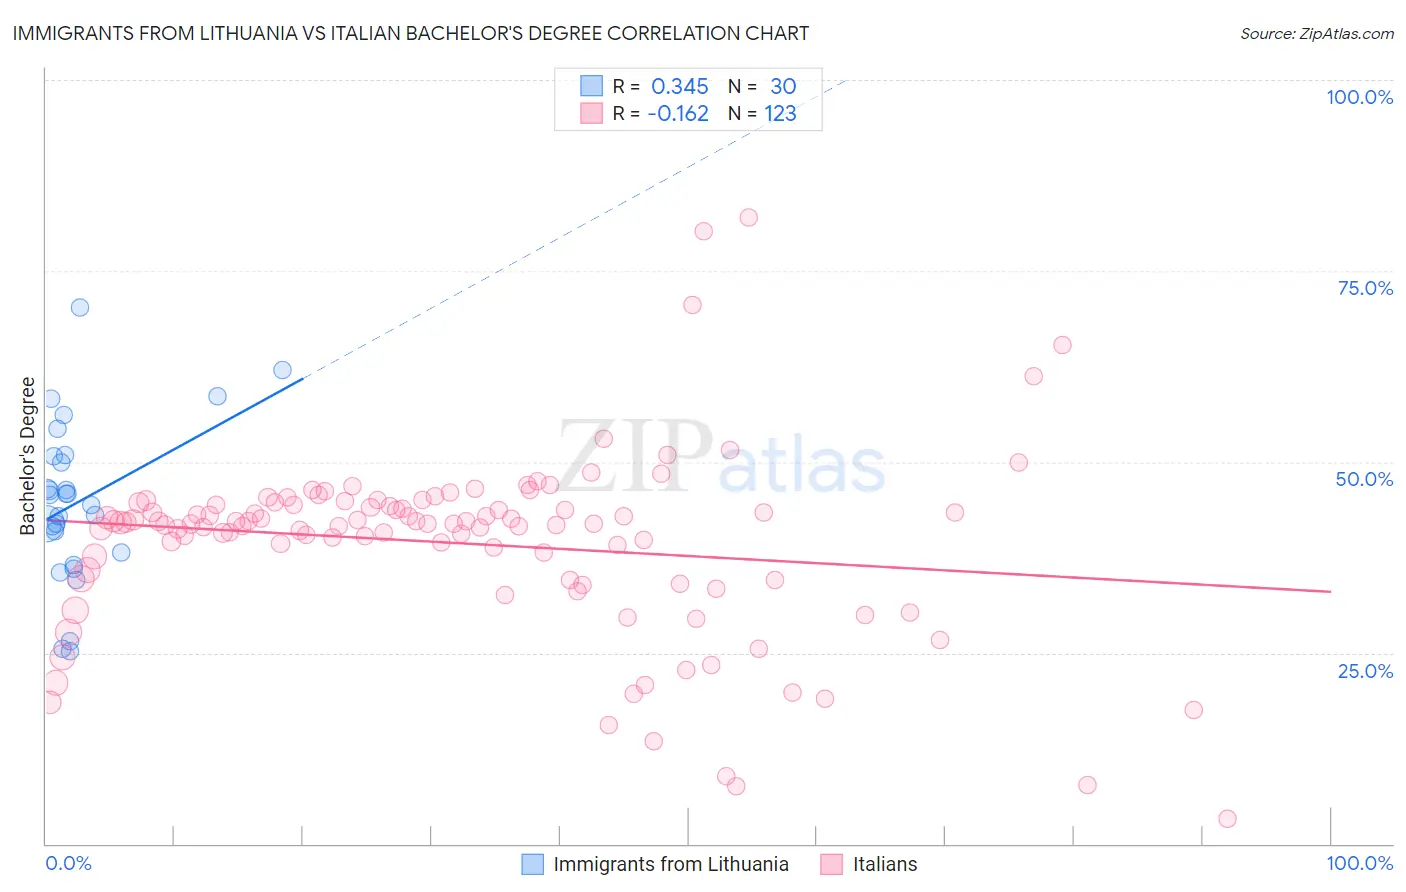
Immigrants from Lithuania vs Italian Bachelor's Degree Correlation Chart
The statistical analysis conducted on geographies consisting of 117,722,731 people shows a mild positive correlation between the proportion of Immigrants from Lithuania and percentage of population with at least bachelor's degree education in the United States with a correlation coefficient (R) of 0.345 and weighted average of 44.6%. Similarly, the statistical analysis conducted on geographies consisting of 574,930,631 people shows a poor negative correlation between the proportion of Italians and percentage of population with at least bachelor's degree education in the United States with a correlation coefficient (R) of -0.162 and weighted average of 40.1%, a difference of 11.4%.
Bachelor's Degree Correlation Summary
| Measurement | Immigrants from Lithuania | Italian |
| Minimum | 25.2% | 3.2% |
| Maximum | 70.2% | 82.0% |
| Range | 45.0% | 78.7% |
| Mean | 44.7% | 39.3% |
| Median | 45.0% | 42.0% |
| Interquartile 25% (IQ1) | 38.1% | 34.5% |
| Interquartile 75% (IQ3) | 50.7% | 44.3% |
| Interquartile Range (IQR) | 12.6% | 9.8% |
| Standard Deviation (Sample) | 10.5% | 12.1% |
| Standard Deviation (Population) | 10.3% | 12.1% |
Similar Demographics by Bachelor's Degree
Demographics Similar to Immigrants from Lithuania by Bachelor's Degree
In terms of bachelor's degree, the demographic groups most similar to Immigrants from Lithuania are Immigrants from Kuwait (44.6%, a difference of 0.030%), Immigrants from Bulgaria (44.6%, a difference of 0.080%), Bolivian (44.6%, a difference of 0.12%), Estonian (44.6%, a difference of 0.12%), and Immigrants from Norway (44.5%, a difference of 0.25%).
| Demographics | Rating | Rank | Bachelor's Degree |
| Russians | 100.0 /100 | #37 | Exceptional 45.3% |
| Bulgarians | 100.0 /100 | #38 | Exceptional 45.3% |
| Immigrants | Latvia | 100.0 /100 | #39 | Exceptional 45.1% |
| Immigrants | Belarus | 100.0 /100 | #40 | Exceptional 45.0% |
| Immigrants | Malaysia | 100.0 /100 | #41 | Exceptional 45.0% |
| Immigrants | Saudi Arabia | 100.0 /100 | #42 | Exceptional 44.8% |
| Immigrants | South Africa | 99.9 /100 | #43 | Exceptional 44.8% |
| Immigrants | Lithuania | 99.9 /100 | #44 | Exceptional 44.6% |
| Immigrants | Kuwait | 99.9 /100 | #45 | Exceptional 44.6% |
| Immigrants | Bulgaria | 99.9 /100 | #46 | Exceptional 44.6% |
| Bolivians | 99.9 /100 | #47 | Exceptional 44.6% |
| Estonians | 99.9 /100 | #48 | Exceptional 44.6% |
| Immigrants | Norway | 99.9 /100 | #49 | Exceptional 44.5% |
| Immigrants | Greece | 99.9 /100 | #50 | Exceptional 44.5% |
| Asians | 99.9 /100 | #51 | Exceptional 44.4% |
Demographics Similar to Italians by Bachelor's Degree
In terms of bachelor's degree, the demographic groups most similar to Italians are Sierra Leonean (40.1%, a difference of 0.080%), Serbian (40.1%, a difference of 0.15%), Taiwanese (40.0%, a difference of 0.25%), Immigrants from Southern Europe (40.0%, a difference of 0.25%), and Immigrants from Venezuela (40.2%, a difference of 0.32%).
| Demographics | Rating | Rank | Bachelor's Degree |
| Immigrants | Eritrea | 94.3 /100 | #124 | Exceptional 40.4% |
| British | 94.2 /100 | #125 | Exceptional 40.4% |
| Immigrants | Eastern Africa | 94.1 /100 | #126 | Exceptional 40.4% |
| Immigrants | Jordan | 93.4 /100 | #127 | Exceptional 40.3% |
| Immigrants | Venezuela | 92.9 /100 | #128 | Exceptional 40.2% |
| Serbians | 92.4 /100 | #129 | Exceptional 40.1% |
| Sierra Leoneans | 92.2 /100 | #130 | Exceptional 40.1% |
| Italians | 91.9 /100 | #131 | Exceptional 40.1% |
| Taiwanese | 91.1 /100 | #132 | Exceptional 40.0% |
| Immigrants | Southern Europe | 91.1 /100 | #133 | Exceptional 40.0% |
| Assyrians/Chaldeans/Syriacs | 89.4 /100 | #134 | Excellent 39.8% |
| Luxembourgers | 89.1 /100 | #135 | Excellent 39.8% |
| Pakistanis | 88.2 /100 | #136 | Excellent 39.7% |
| Icelanders | 86.5 /100 | #137 | Excellent 39.5% |
| Europeans | 85.6 /100 | #138 | Excellent 39.5% |