Inupiat vs Immigrants from Oceania Associate's Degree
COMPARE
Inupiat
Immigrants from Oceania
Associate's Degree
Associate's Degree Comparison
Inupiat
Immigrants from Oceania
32.6%
ASSOCIATE'S DEGREE
0.0/ 100
METRIC RATING
341st/ 347
METRIC RANK
45.8%
ASSOCIATE'S DEGREE
34.7/ 100
METRIC RATING
189th/ 347
METRIC RANK
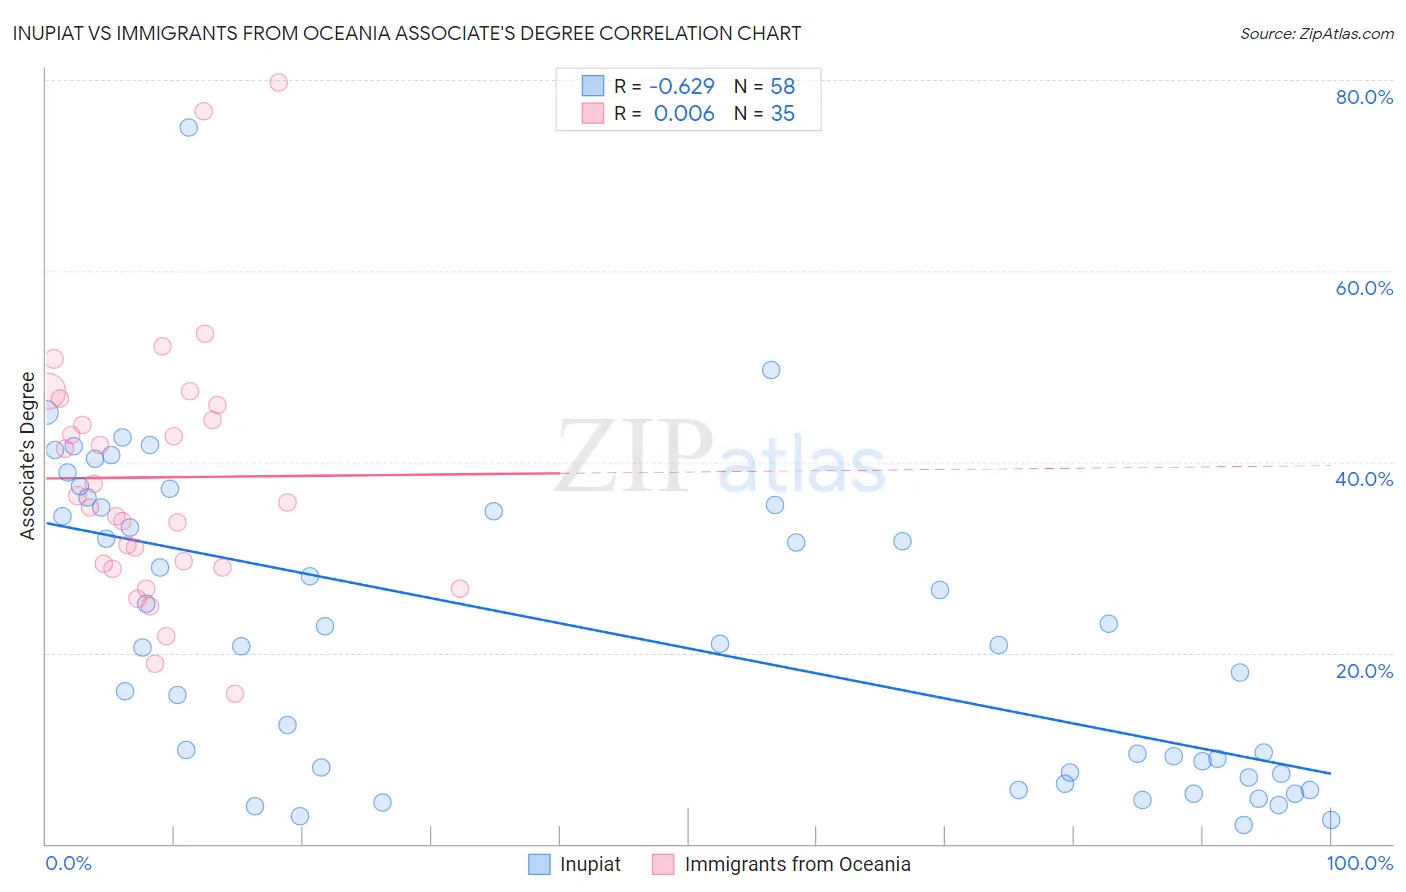
Inupiat vs Immigrants from Oceania Associate's Degree Correlation Chart
The statistical analysis conducted on geographies consisting of 96,347,955 people shows a significant negative correlation between the proportion of Inupiat and percentage of population with at least associate's degree education in the United States with a correlation coefficient (R) of -0.629 and weighted average of 32.6%. Similarly, the statistical analysis conducted on geographies consisting of 305,516,094 people shows no correlation between the proportion of Immigrants from Oceania and percentage of population with at least associate's degree education in the United States with a correlation coefficient (R) of 0.006 and weighted average of 45.8%, a difference of 40.7%.
Associate's Degree Correlation Summary
| Measurement | Inupiat | Immigrants from Oceania |
| Minimum | 1.9% | 15.7% |
| Maximum | 75.0% | 79.8% |
| Range | 73.1% | 64.1% |
| Mean | 22.0% | 38.4% |
| Median | 20.8% | 35.7% |
| Interquartile 25% (IQ1) | 7.3% | 28.9% |
| Interquartile 75% (IQ3) | 35.2% | 46.0% |
| Interquartile Range (IQR) | 27.9% | 17.0% |
| Standard Deviation (Sample) | 16.0% | 13.8% |
| Standard Deviation (Population) | 15.9% | 13.6% |
Similar Demographics by Associate's Degree
Demographics Similar to Inupiat by Associate's Degree
In terms of associate's degree, the demographic groups most similar to Inupiat are Navajo (32.6%, a difference of 0.050%), Yakama (32.3%, a difference of 0.77%), Tohono O'odham (31.8%, a difference of 2.5%), Immigrants from Mexico (33.7%, a difference of 3.6%), and Yuman (31.3%, a difference of 4.2%).
| Demographics | Rating | Rank | Associate's Degree |
| Mexicans | 0.0 /100 | #333 | Tragic 35.0% |
| Natives/Alaskans | 0.0 /100 | #334 | Tragic 34.9% |
| Spanish American Indians | 0.0 /100 | #335 | Tragic 34.9% |
| Hopi | 0.0 /100 | #336 | Tragic 34.6% |
| Lumbee | 0.0 /100 | #337 | Tragic 34.1% |
| Pueblo | 0.0 /100 | #338 | Tragic 34.0% |
| Immigrants | Mexico | 0.0 /100 | #339 | Tragic 33.7% |
| Navajo | 0.0 /100 | #340 | Tragic 32.6% |
| Inupiat | 0.0 /100 | #341 | Tragic 32.6% |
| Yakama | 0.0 /100 | #342 | Tragic 32.3% |
| Tohono O'odham | 0.0 /100 | #343 | Tragic 31.8% |
| Yuman | 0.0 /100 | #344 | Tragic 31.3% |
| Pima | 0.0 /100 | #345 | Tragic 30.2% |
| Houma | 0.0 /100 | #346 | Tragic 28.2% |
| Yup'ik | 0.0 /100 | #347 | Tragic 25.0% |
Demographics Similar to Immigrants from Oceania by Associate's Degree
In terms of associate's degree, the demographic groups most similar to Immigrants from Oceania are Immigrants from Uruguay (45.8%, a difference of 0.060%), Ghanaian (45.8%, a difference of 0.060%), Vietnamese (45.8%, a difference of 0.060%), Korean (45.8%, a difference of 0.070%), and Celtic (45.8%, a difference of 0.12%).
| Demographics | Rating | Rank | Associate's Degree |
| Swiss | 40.4 /100 | #182 | Average 46.0% |
| Yugoslavians | 40.2 /100 | #183 | Average 46.0% |
| Czechoslovakians | 40.0 /100 | #184 | Average 46.0% |
| Costa Ricans | 38.6 /100 | #185 | Fair 46.0% |
| Welsh | 37.9 /100 | #186 | Fair 45.9% |
| Immigrants | Uruguay | 35.5 /100 | #187 | Fair 45.8% |
| Ghanaians | 35.5 /100 | #188 | Fair 45.8% |
| Immigrants | Oceania | 34.7 /100 | #189 | Fair 45.8% |
| Vietnamese | 34.0 /100 | #190 | Fair 45.8% |
| Koreans | 33.8 /100 | #191 | Fair 45.8% |
| Celtics | 33.3 /100 | #192 | Fair 45.8% |
| Immigrants | Cameroon | 31.0 /100 | #193 | Fair 45.7% |
| Immigrants | Peru | 27.6 /100 | #194 | Fair 45.5% |
| Germans | 26.5 /100 | #195 | Fair 45.5% |
| French | 25.6 /100 | #196 | Fair 45.4% |