Pennsylvania German vs Immigrants from Central America Master's Degree
COMPARE
Pennsylvania German
Immigrants from Central America
Master's Degree
Master's Degree Comparison
Pennsylvania Germans
Immigrants from Central America
10.7%
MASTER'S DEGREE
0.0/ 100
METRIC RATING
321st/ 347
METRIC RANK
10.0%
MASTER'S DEGREE
0.0/ 100
METRIC RATING
335th/ 347
METRIC RANK
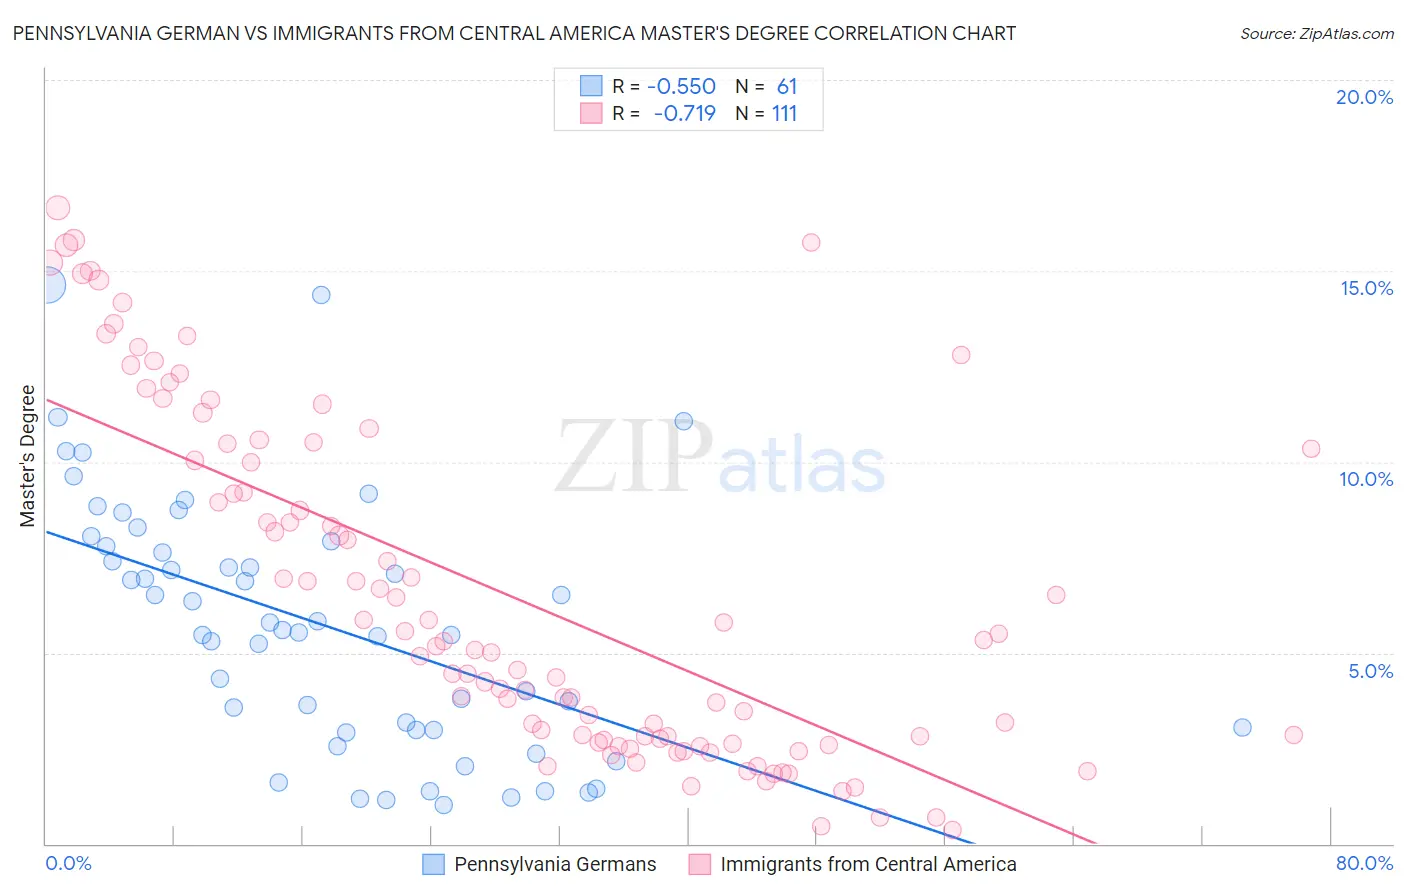
Pennsylvania German vs Immigrants from Central America Master's Degree Correlation Chart
The statistical analysis conducted on geographies consisting of 234,030,574 people shows a substantial negative correlation between the proportion of Pennsylvania Germans and percentage of population with at least master's degree education in the United States with a correlation coefficient (R) of -0.550 and weighted average of 10.7%. Similarly, the statistical analysis conducted on geographies consisting of 535,778,431 people shows a strong negative correlation between the proportion of Immigrants from Central America and percentage of population with at least master's degree education in the United States with a correlation coefficient (R) of -0.719 and weighted average of 10.0%, a difference of 7.6%.
Master's Degree Correlation Summary
| Measurement | Pennsylvania German | Immigrants from Central America |
| Minimum | 1.0% | 0.37% |
| Maximum | 14.6% | 16.7% |
| Range | 13.6% | 16.3% |
| Mean | 5.7% | 6.5% |
| Median | 5.6% | 5.2% |
| Interquartile 25% (IQ1) | 3.0% | 2.7% |
| Interquartile 75% (IQ3) | 7.9% | 10.3% |
| Interquartile Range (IQR) | 4.9% | 7.6% |
| Standard Deviation (Sample) | 3.3% | 4.5% |
| Standard Deviation (Population) | 3.2% | 4.4% |
Demographics Similar to Pennsylvania Germans and Immigrants from Central America by Master's Degree
In terms of master's degree, the demographic groups most similar to Pennsylvania Germans are Immigrants from Micronesia (10.8%, a difference of 0.21%), Sioux (10.7%, a difference of 0.64%), Kiowa (10.8%, a difference of 0.83%), Crow (10.6%, a difference of 1.0%), and Immigrants from Cuba (10.9%, a difference of 1.1%). Similarly, the demographic groups most similar to Immigrants from Central America are Arapaho (10.0%, a difference of 0.13%), Native/Alaskan (9.9%, a difference of 0.50%), Menominee (10.2%, a difference of 2.1%), Immigrants from the Azores (10.2%, a difference of 2.5%), and Mexican (9.7%, a difference of 2.8%).
| Demographics | Rating | Rank | Master's Degree |
| Immigrants | Cuba | 0.0 /100 | #318 | Tragic 10.9% |
| Kiowa | 0.0 /100 | #319 | Tragic 10.8% |
| Immigrants | Micronesia | 0.0 /100 | #320 | Tragic 10.8% |
| Pennsylvania Germans | 0.0 /100 | #321 | Tragic 10.7% |
| Sioux | 0.0 /100 | #322 | Tragic 10.7% |
| Crow | 0.0 /100 | #323 | Tragic 10.6% |
| Dutch West Indians | 0.0 /100 | #324 | Tragic 10.6% |
| Inupiat | 0.0 /100 | #325 | Tragic 10.5% |
| Creek | 0.0 /100 | #326 | Tragic 10.5% |
| Paiute | 0.0 /100 | #327 | Tragic 10.5% |
| Bangladeshis | 0.0 /100 | #328 | Tragic 10.5% |
| Nepalese | 0.0 /100 | #329 | Tragic 10.5% |
| Fijians | 0.0 /100 | #330 | Tragic 10.3% |
| Pueblo | 0.0 /100 | #331 | Tragic 10.3% |
| Immigrants | Azores | 0.0 /100 | #332 | Tragic 10.2% |
| Menominee | 0.0 /100 | #333 | Tragic 10.2% |
| Arapaho | 0.0 /100 | #334 | Tragic 10.0% |
| Immigrants | Central America | 0.0 /100 | #335 | Tragic 10.0% |
| Natives/Alaskans | 0.0 /100 | #336 | Tragic 9.9% |
| Mexicans | 0.0 /100 | #337 | Tragic 9.7% |
| Tohono O'odham | 0.0 /100 | #338 | Tragic 9.7% |